
Figures & data
Table 1. Latent variables and measurement indicators in the model.
Figure 1. The exploratory conceptual model of the EMI.

Figure 2. Questionnaire design and data collection procedure Source: compiled by the author, reference: Bryman (Citation2012).
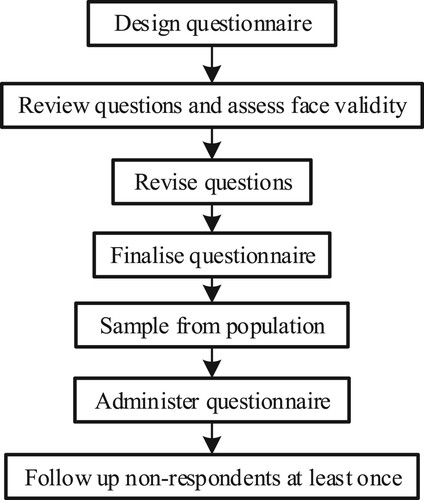
Table 2. Structure of the survey.
Figure 3. The PLS model in the study.
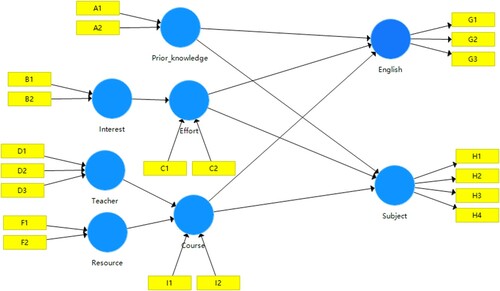
Table 3. Measurement fit for reflective models in this study.
Table 4. Measurement fit for formative models in this study.
Table 5. Goodness of fit for the inner structural model in this study.
Figure 4. The estimated structural model of the diverse effects.
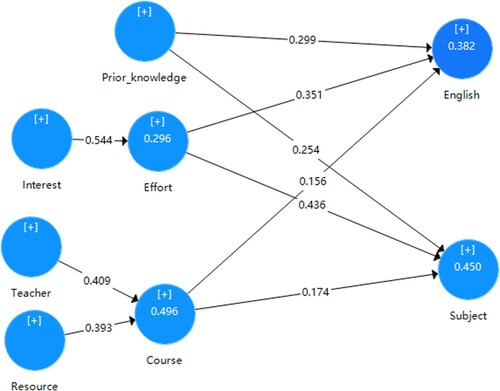
Table 6. Direct and indirect effects.
Table 7. Estimation results of the hypotheses in the study.
Table 8. The strength of the effects of diverse factors on student performance.