
Figures & data
Table 1. Demographics of the participants.
Figure 1. The preliminary model of language learning experience.
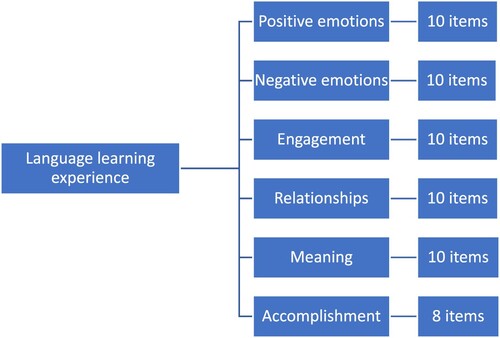
Table 2. Results of exploratory factor analysis: Factors, items, and loadings for 38 items.
Table 3. Total variance explained (seven-factor extraction).
Table 4. The seven factors extracted, the number of items, and Cronbach’s alpha coefficients.
Figure 2. Graphical representation of the six-factor LLES and factor loadings. All modelled correlations and path coefficients are significant (p < .001).
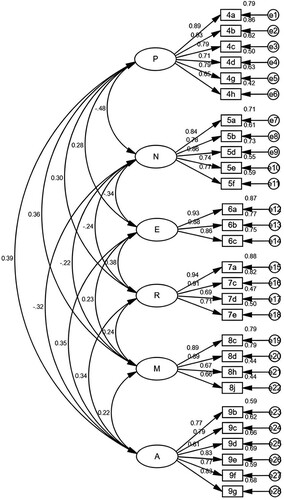
Table 5. Results of the two-round confirmatory factory analysis (N = 304).
Table 6. The convergent validity of each sub-scale.
Table 7. The discriminant validity and inter-construct correlations of each sub-scale