Figures & data
Figure 1. Growth of real GDP for Ethiopia, 1950–2011 (in 2005 PPP$; output-based; log scale).
Source: Penn World Tables 8.0, http://www.rug.nl/research/ggdc/data/pwt/.
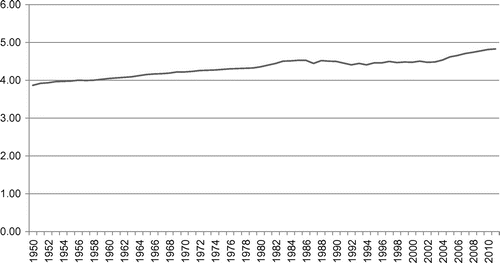
Figure 2. Real GDP per person, and real capital stock per worker for Ethiopia, 1960–2011 (in 2005 PPP$; national accounts).
Notes: RGPP = real GDP per worker (bottom line). RKPW = real capital stock per worker (top line).
Source: Penn World Tables 8.0, http://www.rug.nl/research/ggdc/data/pwt/.
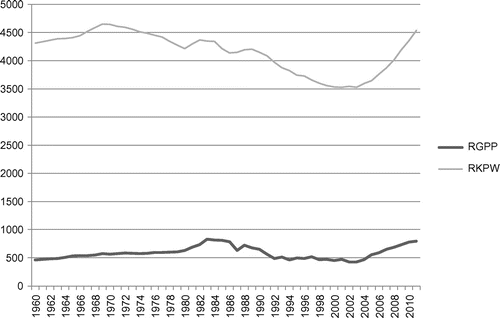
Figure 3. Ethiopia: authority trends, 1946–2013.
Notes: Vertical axis is Polity IV scores. Turning Points: 1974 Revolution, 1991 overthrow of Derg; 2000 split within EPRDF, and 2005 highly polarising parliamentary elections.
Source: Adapted from Systemic Peace database, http://www.systemicpeace.org/polity/eti2.htm.
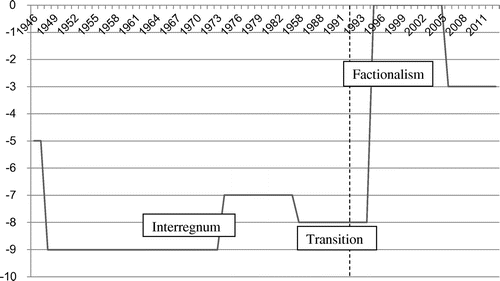
Table 1. Time-line of major aid-related developments, 1990–2012.
Table 2. Ethiopia: trends in respect for citizens’ rights, 2004–14.
Figure 4. Total ODA received by Ethiopia (US$, 2010 prices).
Source: World Bank, African Development Indicators, 2013, http://data.worldbank.org/data-catalog/africa-development-indicators; and World Bank, World Development Indicators, 2013, http://data.worldbank.org/data-catalog/world-development-indicators.
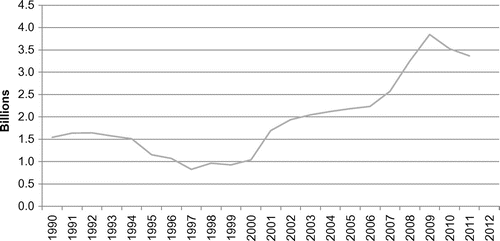
Table 3. Net ODA flows by major donor for Ethiopia, 1990–2011.
Figure 5. World governance ratings for Ethiopia (best to worst: +2.5 to −2.5).
Source: World Bank, African Development Indicators, 2013, http://data.worldbank.org/data-catalog/africa-development-indicators; and World Bank, World Development Indicators, 2013, http://data.worldbank.org/data-catalog/world-development-indicators.
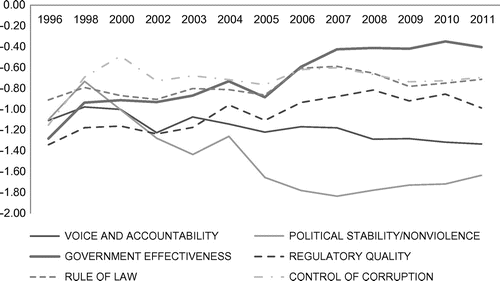
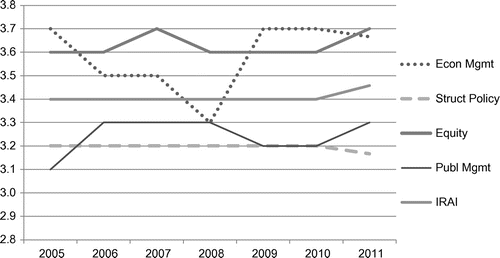
Figure 6. CPIA ratings for Ethiopia.
Notes: IRAI = IDA resource allocation index. CPIA = country policy and institutional assessment.
Source: World Bank, African Development Indicators, 2013, http://data.worldbank.org/data-catalog/africa-development-indicators; and World Bank, World Development Indicators, 2013, http://data.worldbank.org/data-catalog/world-development-indicators.
