
Figures & data
Figure 1. Changes in Indonesia’s poverty headcount ratio (In 2011 purchasing power parity, PPP).
Source: World Development Indicators Database, World Bank.
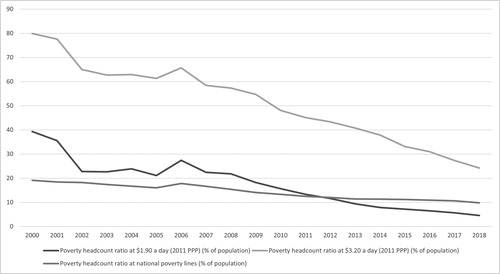
Table 1. Occupational backgrounds of legislators and their fathers.
Table 2. Survey questions.
Table 3. Comparison of means.
Figure 2. Occupational class of citizens and legislators.
Source: Legislator results are taken from our survey of Indonesian provincial legislators conducted by the Indonesian Survey Institute (LSI) between December 2017 and March 2018; citizen results are from a nationally representative survey conducted by LSI in May 2017.
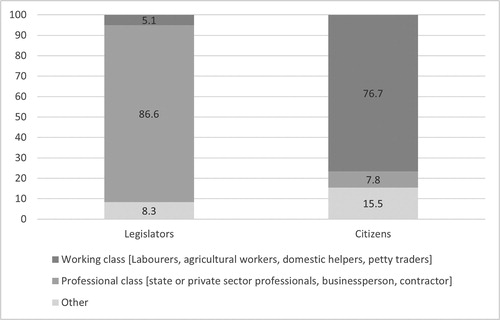
Figure 3. Government must determine prices – 93.2% overlap.
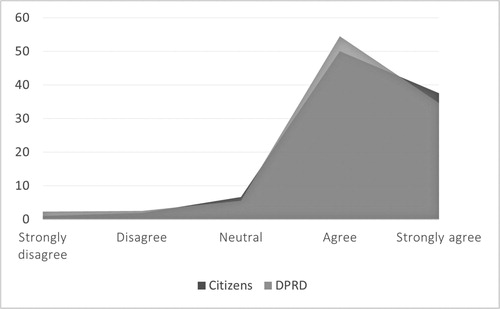
Figure 4. Government must establish a minimum wage – 91.5% overlap.
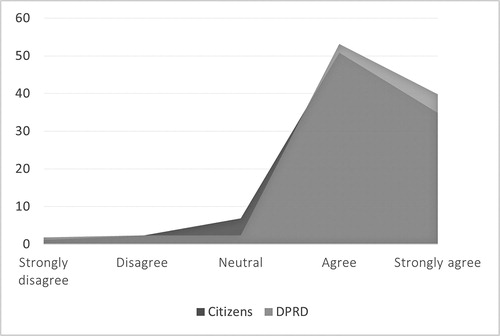
Figure 5. Indonesia should be more open to foreign trade – 83.3% overlap.
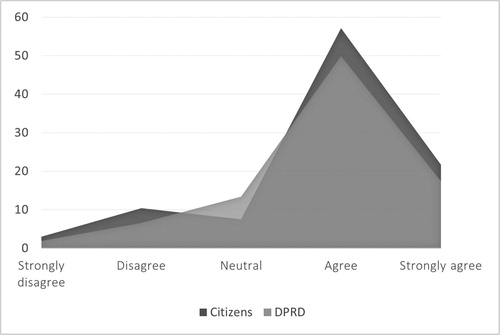
Figure 6. Indonesia should be more open to foreign investment – 82.9% overlap.
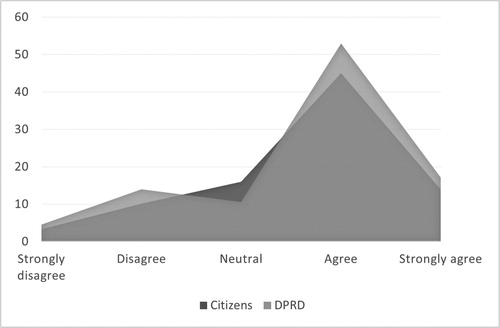
Figure 7. More assistance should be provided to the poor by raising taxes – 72% overlap.
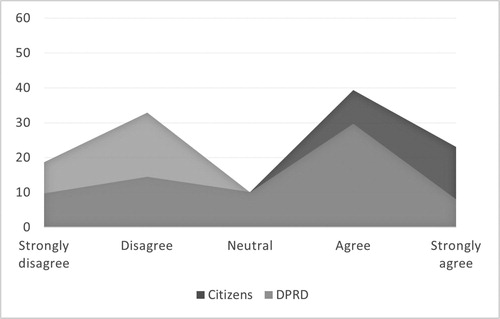
Figure 8. The unemployed should receive government subsidies – 73.2% overlap.
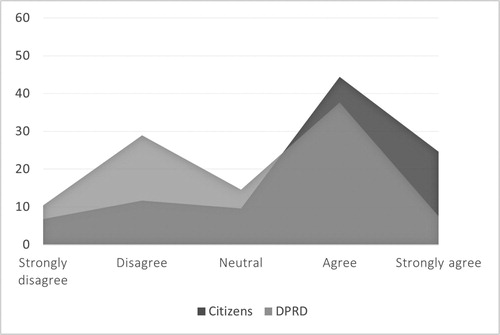
Figure 9. Indonesia should be more open to foreign immigrants – 64.4% overlap.
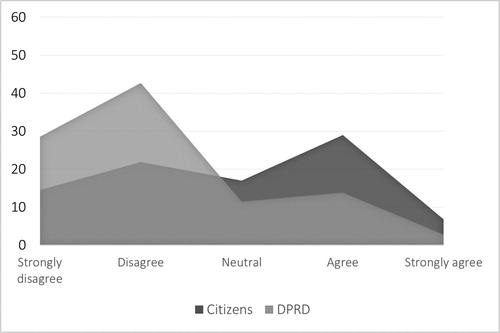
Figure 10. Total congruence (%).
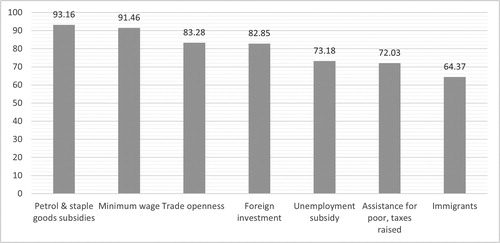
Table 4. Overlap between legislators and citizens (by citizens’ social class).