
Figures & data
Table 1. Numbers of semi-structured interviews and questionnaires completed by location.
Figure 1. Policy actors’ perceptions of their offices’ prioritisation of gender-related activities in Uganda.
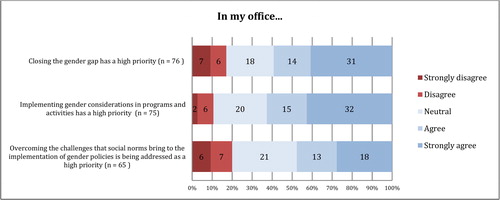
Table 2. Perceptions of priorities for addressing the causes of gender inequality.
Table 3. Perceptions of causes of insufficient impact of gender policies in agriculture and climate change.
Table 4. Proposed actions to address gender inequalities in agriculture and climate change.
Table 5. Proposed actions to address the gender policy implementation gap.
Table 6. Proposed actions to address challenges to gender equality from rigid social norms.