Figures & data
Table 1. Three main cooperation modalities.
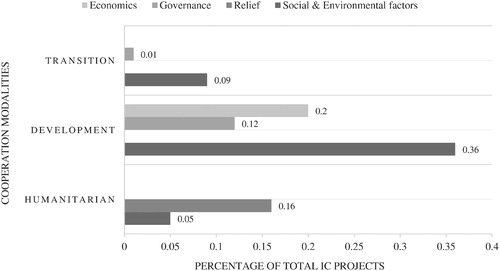
Figure 1. Percentage distribution of the total sample by cooperation modality.
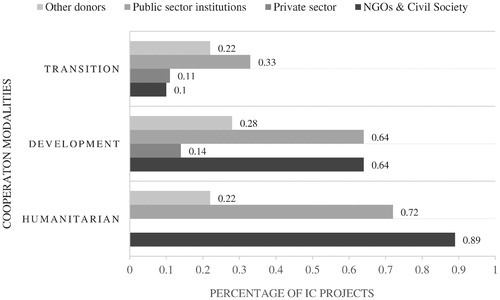
Figure 2. Percentage of each actor’s involvement over the total projects by modality (eg NGOs and civil society were key actors in 89% of the total humanitarian aid projects).
Note: NGOs & CS: non-governmental organisations and civil society; PS: private sector; PSI: public sector institutions; OD: other donors.
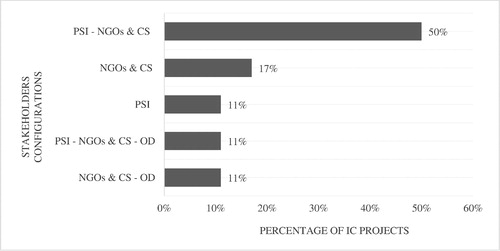
Figure 3. Percentage of key actors’ partnerships over all humanitarian aid modality projects. Note: NGOs & CS: non-governmental organisations and civil society; PS: private sector; PSI: public sector institutions; OD: other donors.

Figure 4. Percentage of key actors’ partnerships over all development assistance modality projects. Note: NGOs & CS: non-governmental organisations and civil society; PS: private sector; PSI: public sector institutions; OD: other donors.
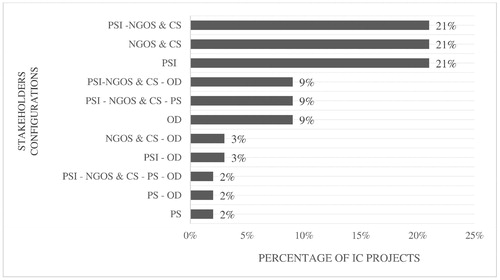
Figure 5. Percentage of thematic fields by modality, over the total sample (eg 9% out of the total projects corresponded to social and environmental factors in the transitional modality).