
Figures & data
Table 1. Distribution of the EUTF’s committed resources along geographic and thematic priorities, 2020.
Table 2. NGDOs involved in EUTF projects, 2015–2020.
Table 3. Summary statistics.
Table 4. Probit regression results on the determinants of NGDO participation in EUTF projects.
Figure 1. Marginal effects of migration management across action budgets.
CIs: confidence intervals. Source: Author’s elaboration.
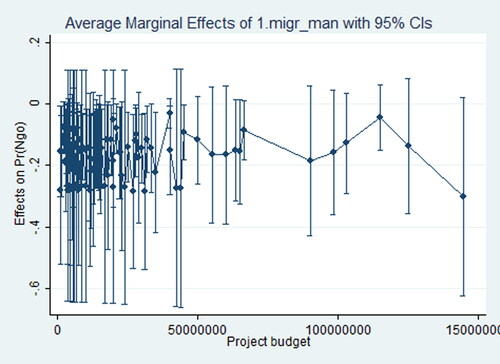
Figure 2. Marginal effects of strengthening resilience across action budgets.
CIs: confidence intervals. Source: Author’s elaboration.
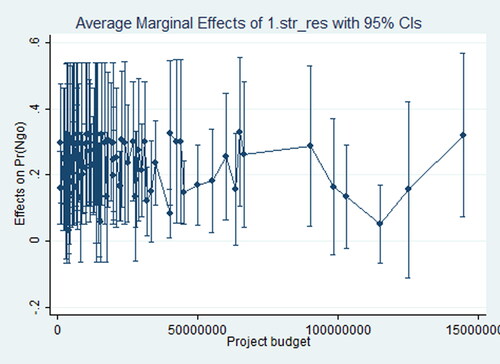
Table 5. Average marginal effects of migration management and strengthening resillience on the probability of NGDO participation in EUTF projects.
Table 6. Breakdown of Improved migration management projects according to their main activities.