
Figures & data
Table 1. Sino–Kazakhstan joint projects planned and completed between 1997 and 2022.
Table 2. Kazakhstan’s trade with China and the world, 2000–2019 (billions USD).
Figure 1. Kazakhstan’s exports to China: total value by category, 2000–2019.
Source: World Integrated Trade Solution data, World Bank, available at: https://wits.worldbank.org/CountryProfile/en/Country/KAZ/Year/2019/TradeFlow/EXPIMP/Partner/CHN/Product/all-groups (accessed 16 June Citation2021).
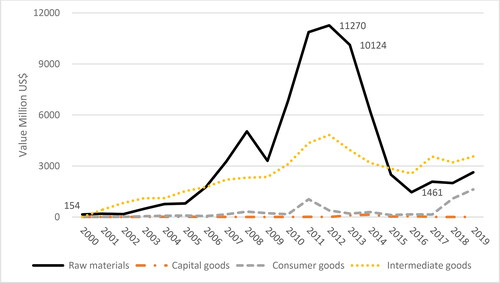
Figure 2. Kazakhstan’s exports to China: shares by category, 2000–2019.
Source: World Integrated Trade Solution data, World Bank, available at: https://wits.worldbank.org/CountryProfile/en/Country/KAZ/Year/2019/TradeFlow/EXPIMP/Partner/CHN/Product/all-groups (accessed 16 June 2021).
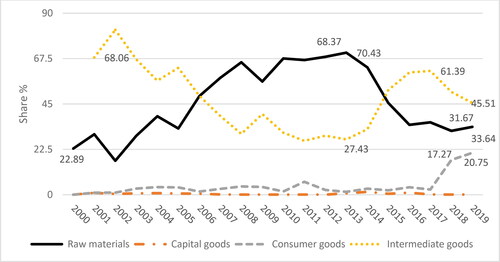
Figure 3. Kazakhstan’s fuel exports to China: total value and shares, 2000–2019.
Source: World Integrated Trade Solution data, World Bank, available at: https://wits.worldbank.org/CountryProfile/en/Country/KAZ/Year/2019/TradeFlow/EXPIMP/Partner/CHN/Product/all-groups (accessed 16 June 2021).
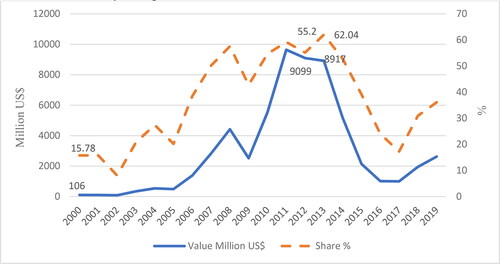
Figure 4. Kazakhstan’s imports from China: total value by category, 2000–2019.
Source: World Integrated Trade Solution data, World Bank, available at: https://wits.worldbank.org/CountryProfile/en/Country/KAZ/Year/2019/TradeFlow/EXPIMP/Partner/CHN/Product/all-groups (accessed 16 June 2021).
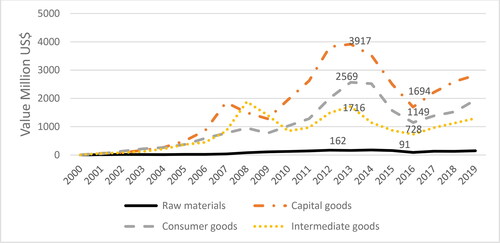
Figure 5. Kazakhstan’s imports from China: shares by category, 2000–2018.
Source: World Integrated Trade Solution data, World Bank, available at: https://wits.worldbank.org/CountryProfile/en/Country/KAZ/Year/2019/TradeFlow/EXPIMP/Partner/CHN/Product/all-groups (accessed 16 June 2021).
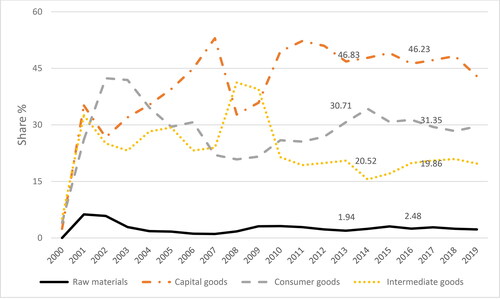
Table 3. Kazakhstan’s debt to and foreign direct investment (FDI) from China, 2014–2020.
Table 4. Five of the 100 steps to reform put forward by former President Narbarzabev in 2015.