Figures & data
Table 1. Information about schools and respondents.
Table 2. Backgrounds of surveyed families.
Figure 1. Purpose of school visit by family.
Note: The pie chart summarises survey data from 402 families averaged across Udaipur and Patna. The bar chart is for the 350 families who report that they visit their child’s school (averaged across Udaipur and Patna); the sum of bar percentages exceeds 100 as the survey question allowed multiple responses.Footnote3
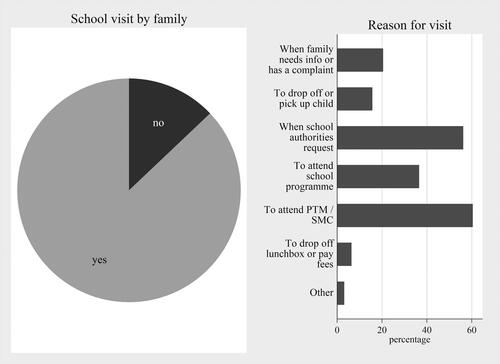
Figure 2. Topics of discussion between school and family.
Note: The bar chart represents the 193 families who reported that they discuss matters connected with their child (averaged across Udaipur and Patna); the sum of bar percentages exceeds 100 as the survey question allowed multiple responses. Missing bars indicate 0 respondents for that option (for instance, child’s mobile phone usage in government schools or NFEs).
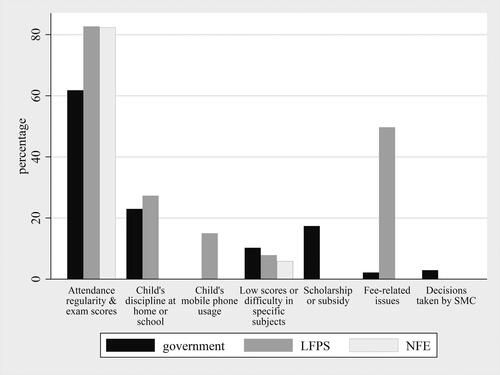
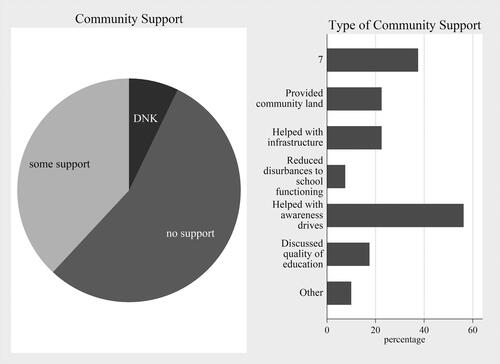
Figure 3. Community support for government schools and NFEs.
Note: The pie chart summarises survey data from 70 community leaders in the location of the schools studied (averaged across Udaipur and Patna); DNK stands for ‘do not know’. The data presented are for government schools and NFEs alone; in all cases, LFPSs received no support. The bar chart represents the subset of respondents who said that the community provides ‘some support’ (averaged across Udaipur and Patna); the sum of bar percentages exceeds 100 as the survey question allowed multiple responses.