
Figures & data
Figure 1. Homicide rates in Latin America from 1981 to 2015.
Source: World Health Organization Causes of Death Database.
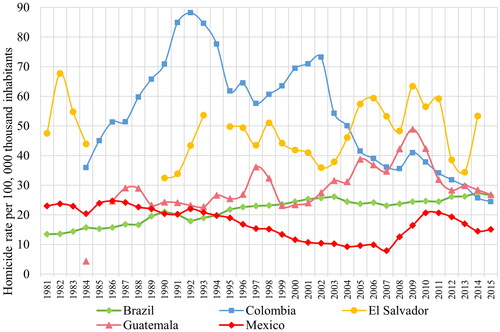
Figure 2. Share of deaths from homicide by regions, 1990 to 2017.
Source: Global Burden of Disease Collaborative Network. Global Burden of Disease Study 2017. Results. Seattle, United States: Institute for Health Metrics and Evaluation (IHME), 2018. Map: https://ourworldindata.org/homicides.
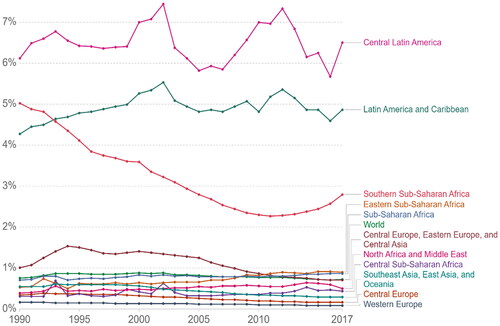
Table 1. Concepts relating to Latin American violence and criticisms.