
Figures & data
Figure 1. Regional ODA to African RIOs and the African Union, 2002–2016 (US$ million).
Source: authors’ dataset.
Figure showing evolution over time of total regional foreign aid to all regional organisations in Africa compared to regional foreign aid directed towards the AU.
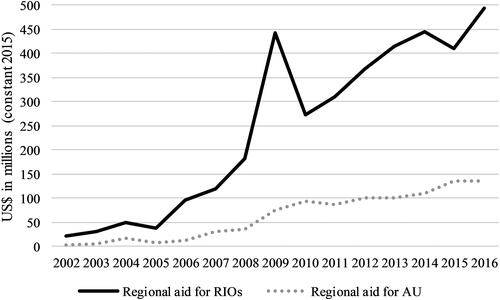
Table 1. Policy and implementation involvement towards RIOs.
Table 2. Overview of regional ODA to the African Union (2002–2016).
Table 3. Donor approaches towards the African Union.