Figures & data
Figure 1. Total humanitarian assistance from four Gulf states, 2012–2021 (USD million). Source: OCHA FTS (Citationn.d.).
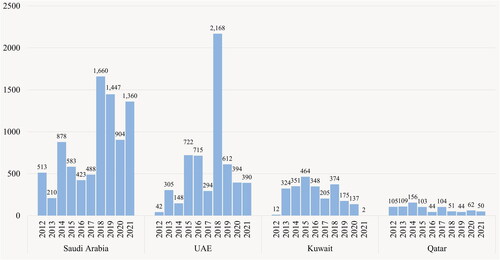
Figure 2. Share of combined Gulf humanitarian assistance by country, 2012–2021. Source: OCHA FTS (Citationn.d.).
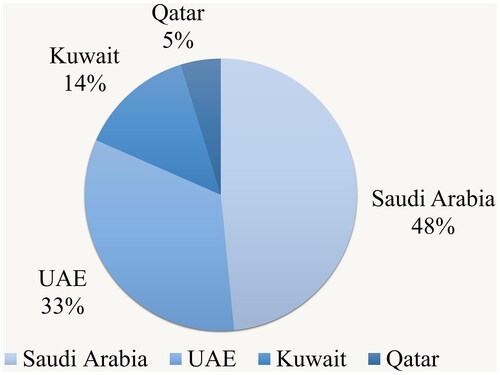
Figure 3. Total Gulf countries’ humanitarian aid per capita, 2015–2020 (USD million). Sources: OCHA FTS (Citationn.d.); UN DESA (Citation2020); GCC-Stat (Citationn.d.); Saudi General Authority for Statistics (Citationn.d.); Qatar Planning and Statistics Authority (PSA) (Citationn.d.).Footnote1
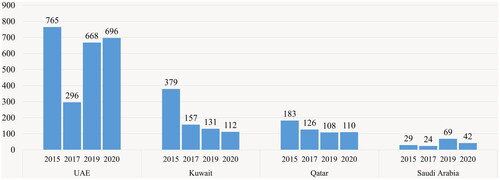
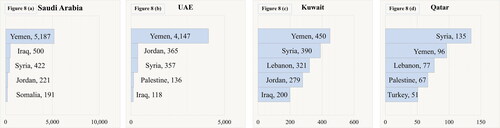
Figure 4. Saudi Arabia’s top five humanitarian aid recipients, 2012–2021 (USD million). Source: OCHA FTS (Citationn.d.).
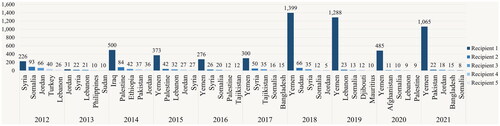
Figure 5. UAE’s top five humanitarian aid recipients, 2012–2021 (USD million). Source: OCHA FTS (Citationn.d.).
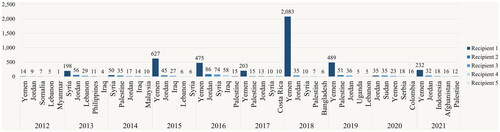
Figure 6. Kuwait’s top five humanitarian aid recipients, 2012–2021 (USD million). Source: OCHA FTS (Citationn.d.).
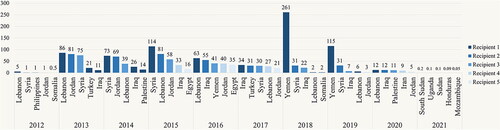
Figure 7. Qatar’s top five humanitarian aid recipients, 2012–2021 (USD million). Source: OCHA FTS (Citationn.d.).
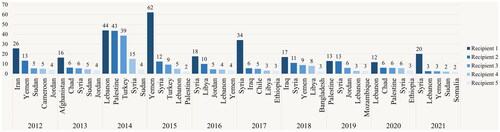
Figure 8. Total Gulf countries’ humanitarian aid to their top five recipients, 2012–2021 (USD million). Source: OCHA FTS (Citationn.d.).