Figures & data
Figure 1. Cycling modal share across local authorities in England and Wales in 2001 and 2011, and change in prevalence of cycle modal share from 2001 to 2011.
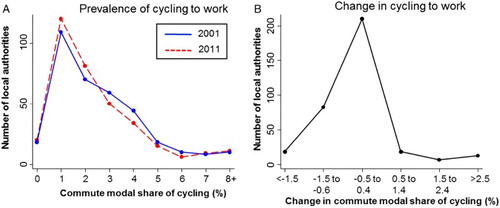
Figure 2. Distribution of ratios of (A) female cyclists and (B) older adult cyclists across 346 local authorities in England and Wales in 2001 and 2011.
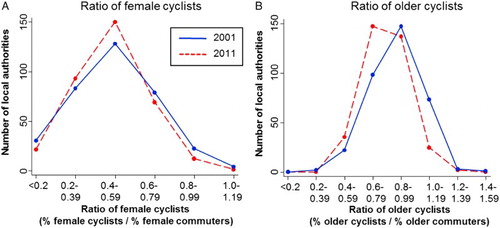
Figure 3. Representation of females among cyclists across 346 local authorities in England and Wales according to the overall modal share of cycling, cross-sectionally and over time.

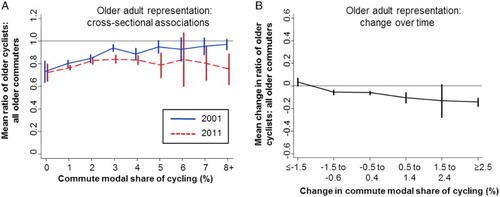
Figure 4. Representation of older adults among cyclists across 346 local authorities in England and Wales, cross-sectionally and over time.