Figures & data
Figure 1. A stable time path for a logistic growth curve.
Figure 2. The standard static ‘operating speed' versus ‘volume' relationship.
Figure 3. A typical mote installed on a lamp column.
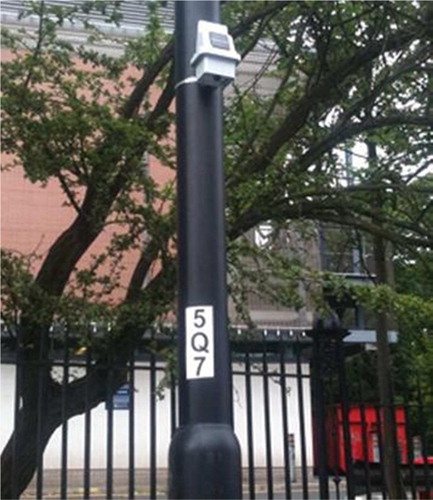
Figure 4. Typical Bluetooth installed on a traffic signal pole.
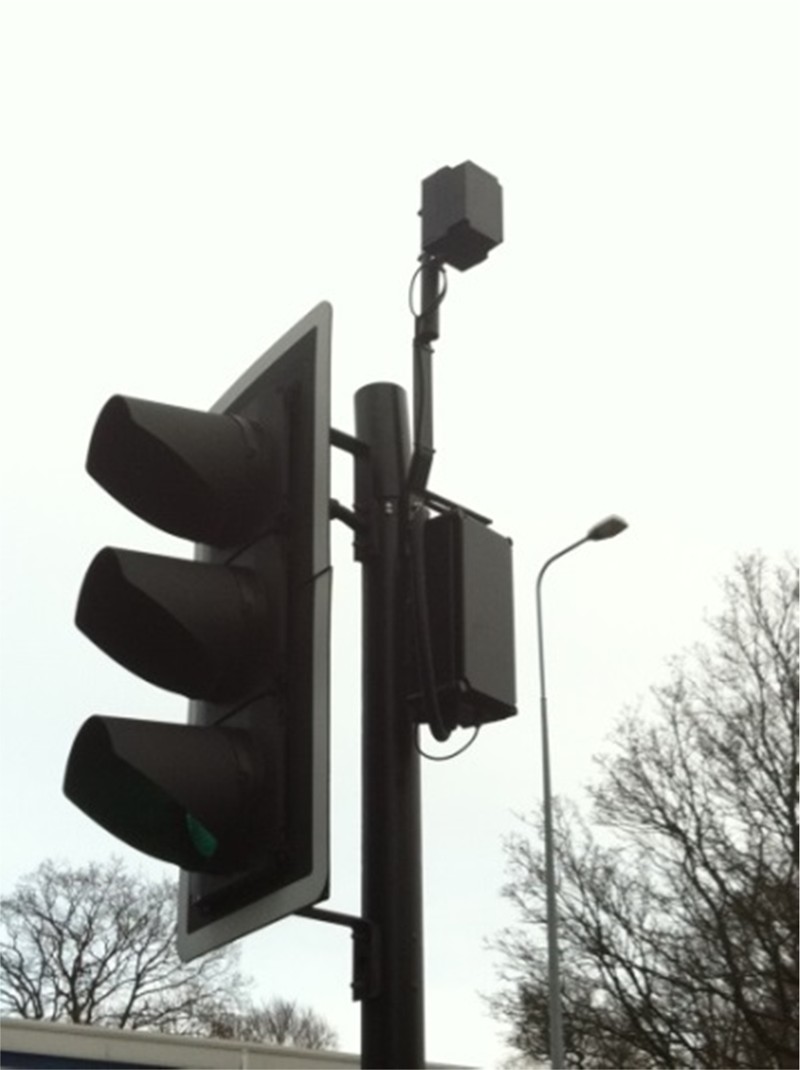
Figure 5. The flow of information in a SCOOT-based urban traffic control system.
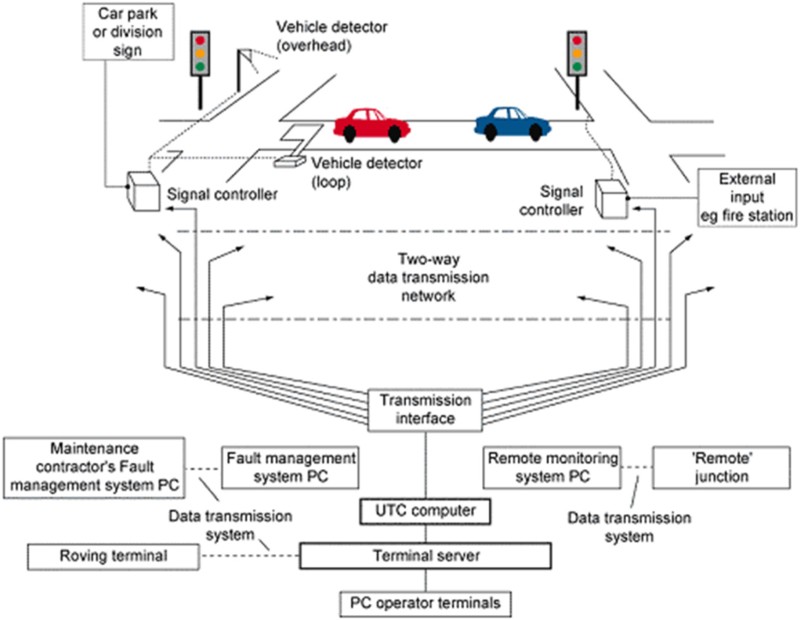
Figure 6. The schematic diagram for an ANPR system (Yasin, Karim, & Abdullah, Citation2009).
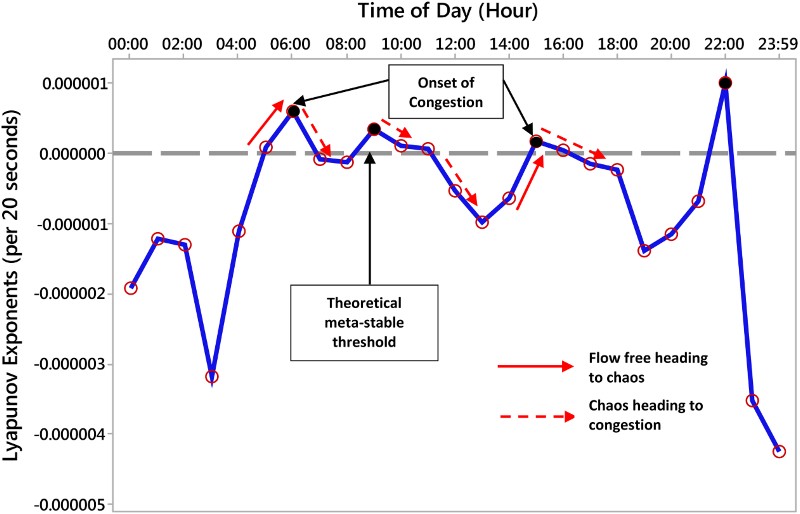
Figure 7. Typical 24-hour profile of Lyapunov exponents (5 July 1999) for Link 29.