Figures & data
Figure 1. China’s GDP and percentage of GDP devoted to R&D 1996–2015.
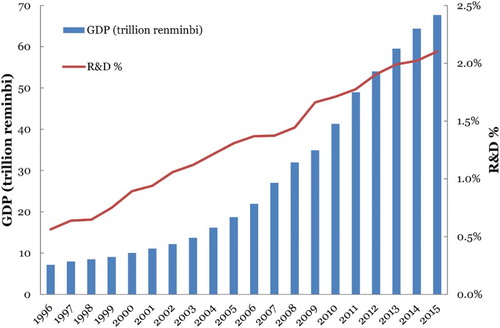
Figure 2. Trends of the number of publications and the market shares of China and the USA from 1996 to 2015.
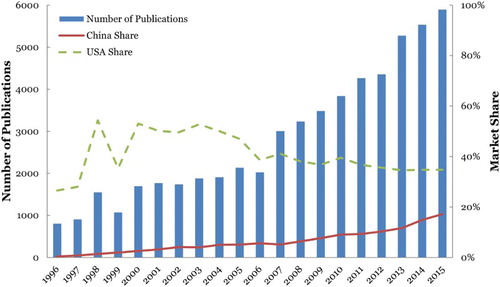
Table 1. Geographical distribution of publications from 1996 to 2015.
Table 2. Citation records 2011–2015.
Table 3. Top 10 funding sources acknowledged in publications 2011–2015.
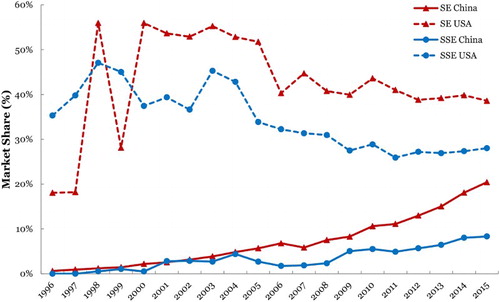
Figure 3. The SE and SSE market share trends of China and the USA from 1996 to 2015.