Figures & data
Table 1. Overview of relevant contributions on port authority strategy.
Table 2. Measurement tool for mapping executives’ strategic beliefs.
Figure 1. Mean score of executives of set of “regular” firms (n = 125). Source: representation of results of Meyer (Citation2007).
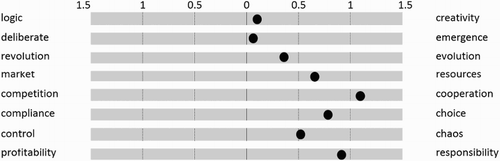
Figure 2. Comparing PAs (n = 65) with mixed set of private companies (n = 125).
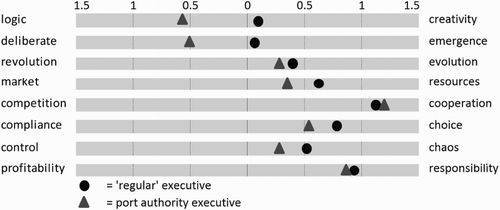
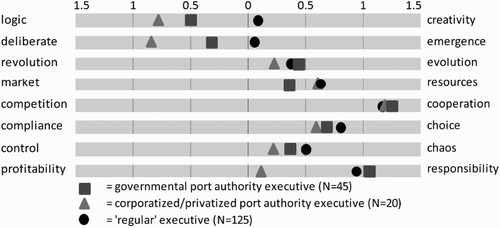
Figure 3. Corporatised/privatised PAs (N = 20) versus non-corporatised PAs (N = 45).