Figures & data
Figure 1. Overview of possible intermodal rail terminal functions in a rail network. Source: Based on Bontekoning (Citation2006).
Table 1. Intermodal rail terminal types distinguished according to volume.
Table 2. Overview of terminal characteristics.
Table 3. Overview of handling cost in the IRT literature.
Figure 2. Cost structure for an investor in terminal infrastructure. Source: Adapted from Wiegmans, Masurel, and Nijkamp (Citation1999).
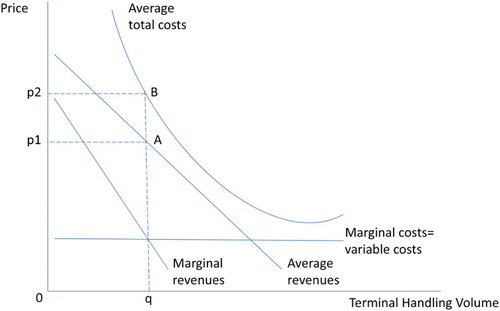
Figure 3. Decreasing, constant, and increasing RTS. Source: Adapted from Hensher and Brewer (Citation2001).
Table 4. Intermodal rail terminal assets.
Table 5. The cost per intermodal rail terminal type.
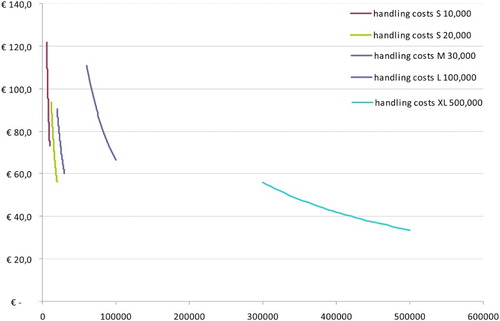
Figure 4. Handling costs of a small IRT with maximum capacity of 10,000 ILUs. Handling costs are depicted for handling 6000 (60% capacity filling) up to 10,000 (100% capacity filling) ILUs.
Figure 5. Handling costs of a small IRT with a maximum capacity of 20,000 ILUs. Handling costs are depicted for handling 12,000 (60% capacity filling) up to 20,000 (100% capacity filling) ILUs.
Figure 6. Handling costs of a medium IRT with a maximum capacity of 30,000 ILUs. Handling costs are depicted for handling 20,000 (67% capacity filling) up to 30,000 (100% capacity filling) ILUs.
Figure 7. Handling costs of a large IRT with a maximum capacity of 100,000 ILUs. Handling costs are depicted for handling 60,000 (60% capacity filling) up to 100,000 (100% capacity filling) ILUs.
Figure 8. Handling costs of an XL IRT with a maximum capacity of 500,000 ILUs. Handling costs are depicted for handling 300,000 (60% capacity filling) up to 500,000 (100% capacity filling) ILUs.
Figure 9. Handling costs of all five IRTs assuming 60–100% capacity. Handling costs are depicted for handling (60% capacity filling) to (100% capacity filling) ILUs.