Figures & data
Figure 1. PIDA’s transport network plan (PIDA, Citation2012). [TAH: Trans-African Highway].
![Figure 1. PIDA’s transport network plan (PIDA, Citation2012). [TAH: Trans-African Highway].](/cms/asset/d740ffd0-3089-4563-83a1-ca86bc874884/ttrv_a_1414899_f0001_oc.jpg)
Figure 2. Evolution of the transport networks in Sub-Saharan Africa: an explanatory timeline.
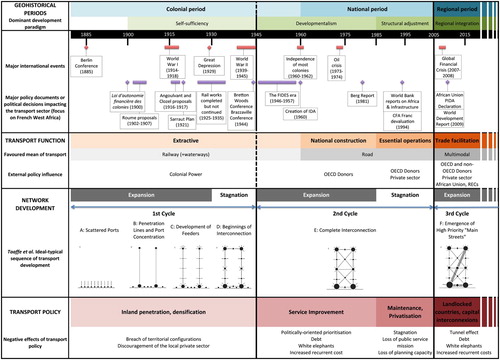
Figure 3. Rail lines in service in West Africa in 1914, 1963 and 2010.
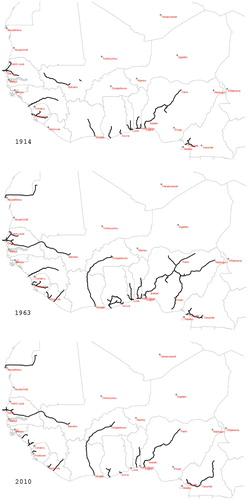
Figure 4. Trade estimates for the African road network (USD, million) and % changes in trade after road upgrading (Buys et al., Citation2010).
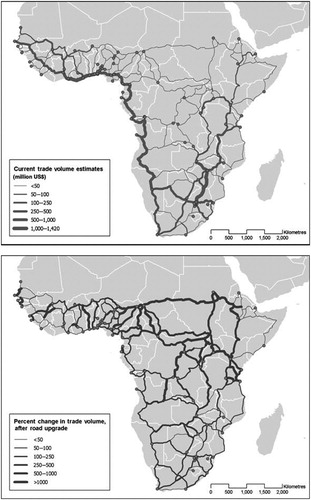
Figure 5. Main paved or partially improved roads within ECOWAS (Economic Community of West African States, Citation2005).
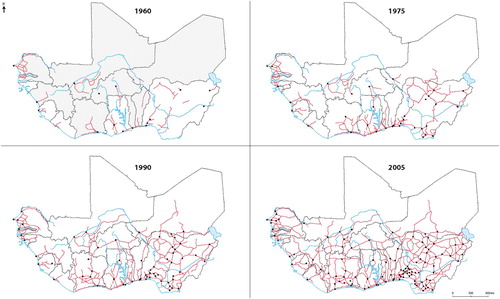
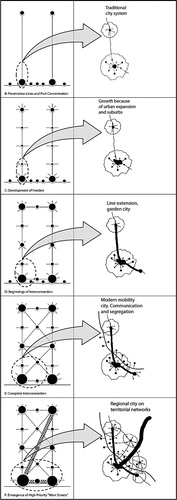
Figure 6. The correspondence between the ideal-typical sequence of Taaffe et al. (Citation1963) and the metropolisation process model shaped by transport infrastructure (Herce & Magrinyà, Citation2002).