Figures & data
Figure 1. Severity levels of traffic events. Adapted from Hydén (Citation1987) and Svensson (Citation1998).
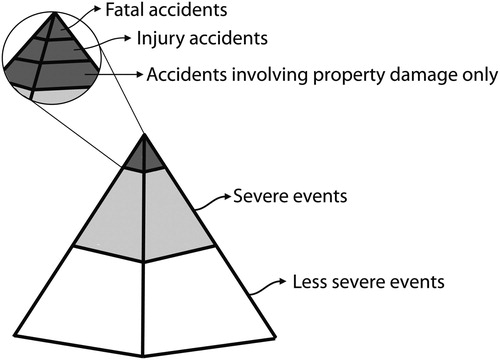
Table 1. Factors affecting collision risk and injury risk, respectively.
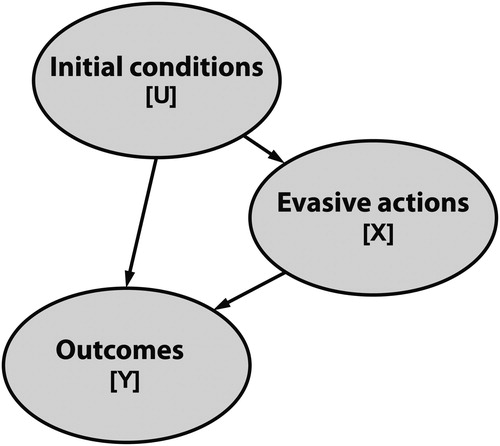
Figure 2. Causal model. Adopted from Davis et al. (Citation2011).