Figures & data
Table 1. List of criticality metrics used in this study.
Table 2. Topological properties of the networks.
Figure 1. Illustration of the three-step empirical comparison: (a) listing of the 100 most critical links based on each metric for each network, (b) Spearman-rank correlations among the metrics in each network, (c) three robustness indicators summarising the eight networks.
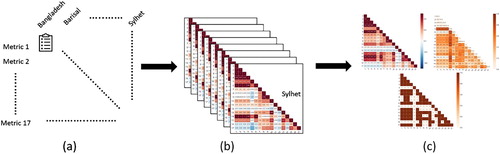
Figure 2. (a) Average, (b) Range, and (c) Consistency indicators of the correlation coefficients between all metrics pairs across the eight networks. The numbers on the axes corresponds to the metrics in .
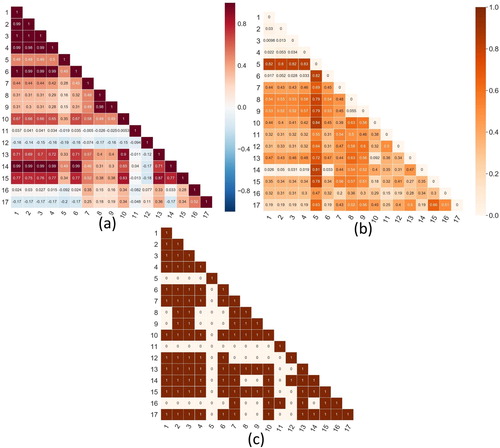
Figure 3. Grouping of empirical similarities among the metrics.
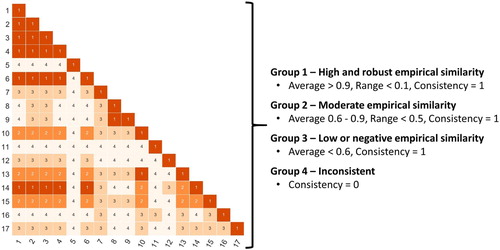
Figure 4. Distribution of absolute difference in metrics correlation coefficients among several pairs of networks.
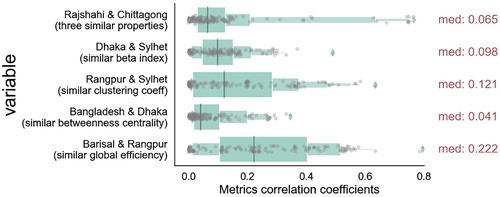
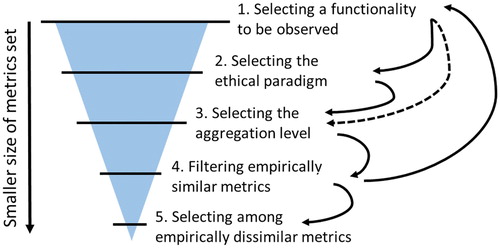
Figure 5. A five-step guideline to select criticality metrics.