
Figures & data
Table 1. Cities or regions contributing to country-level analysis (countries for which dataset was combined from multiple cities/regions).
Table 2. Cycling behaviour and characteristics of cyclists for urbanised areas nationwide (listed in the descending order of cycling mode share).
Table 3. Cycling behaviour and characteristics of cyclists in the selected cities (listed in the descending order of cycling mode share).
Table 4. Distance-based ratios of cycling across countries (ratio of proportion of cycle trips in a distance bin to the proportion of all trips in that distance bin; heat map shows gradation of all values combined; correlations are presented between mode shares and ratios within each distance bin).
Table 5. Distance-based ratios of cycling trips in selected cities (ratio for each distance bin is the ratio of proportion of all cycle trips in a distance range to the proportion of all trips in that range; heat map shows gradation of all values combined; correlations are presented between mode shares and ratios within each distance bin).
Figure 1. Gender representation and level of cycling in cities and countries (cities are mentioned along with their respective country 3-letter codes – ARG: Argentina, AUS: Australia, BRA: Brazil, CAN: Canada, CHL: Chile, COL: Colombia, ENG: England, DEU: Germany, IND: India, JPN: Japan, KEN: Kenya, MEX: Mexico, NLD: Netherlands, ZAF: South Africa, CHE: Switzerland, USA: United States of America)
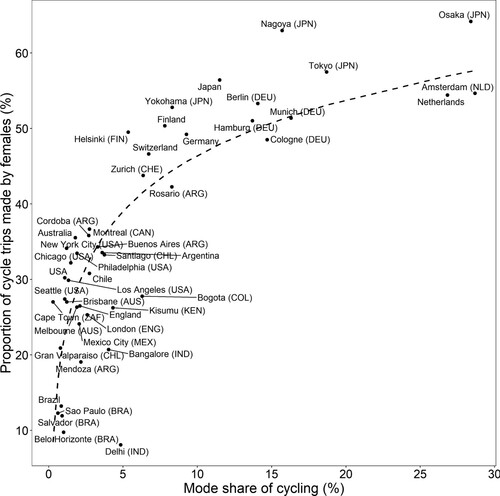
Table 6. Age-specific female representation ratios of the urbanised areas countrywide (ratio of the proportion of women in cycling trips to the proportion of women in all trips within each age group; heat map shows gradation of all values combined, red: underrepresentation (ratio <0.7), yellow/green: moderate to proportional representation (0.7 <ratio< 1) and green: overrepresentation (>1); correlations of the representation ratios for each age group with the cycling mode shares, along with their P-values of statistical significance).
Table 7. Age-specific female representation ratios for the selected cities (ratio of the proportion of women in cycling trips to the proportion of women in all trips within each age group; heat map shows gradation of all values combined, red: underrepresentation (ratio < 0.7), yellow/green: moderate to proportional representation (0.7 < ratio < 1) and green: overrepresentation (> 1); correlations of the representation ratios for each age group with the cycling mode shares, along with their P-values of statistical significance).
Table 8. Cycling typology of cities and countries based on overall mode share of cycling, share of women among cycling trips, and age representation ratios (asterisks represent countries not included for clustering analysis, but placed next to the cluster with most of their contributing cities).