
Figures & data
Figure 1. Overview of the production and operational flow of the data, partly inspired by OECD (Citation2019).
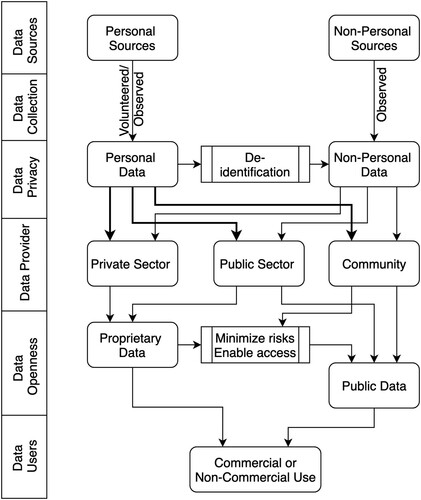
Figure 2. The trend of articles in SCOPUSFootnote22 published from 2005 to 2019 with the keywords: (top) “public data”, “publicly available data”, “open data”, and “open government data”; (bottom) combinations of “publicly available data” (left) and “open data” (right) with transport domain keywords.
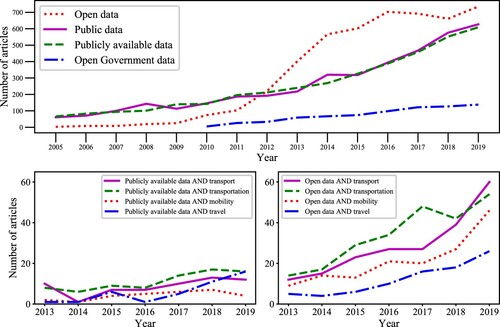
Figure 3. Public availability/ openness attributes (Extending the concentric shell model by Backx (Citation2003), English translation by van Loenen and Grothe (Citation2014), in the top right corner).
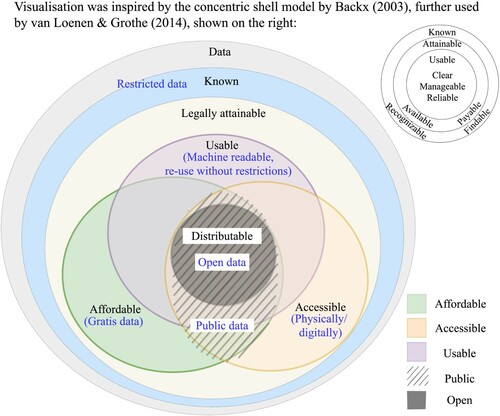
Table 1. Data Classification.
Figure 4. Public availability and applications of the prominent datasets used in transport modelling.
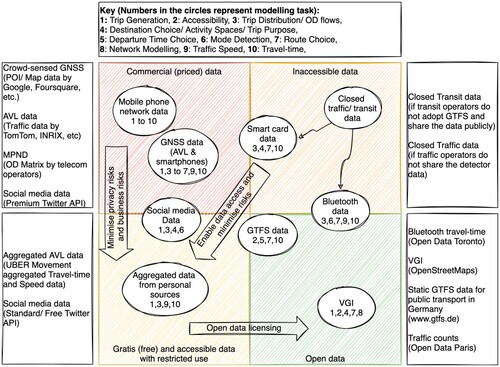
Table 2. SWOT Analysis.