Figures & data
Figure 1. Preferred reporting items for systematic reviews and meta-analyses (PRISMA) flow diagram of information through the stages of the review.
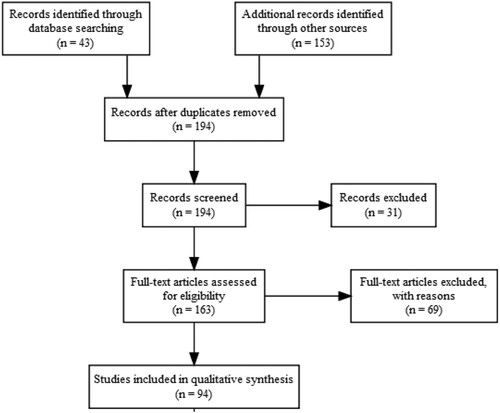
Figure 2. Availability of replication material.
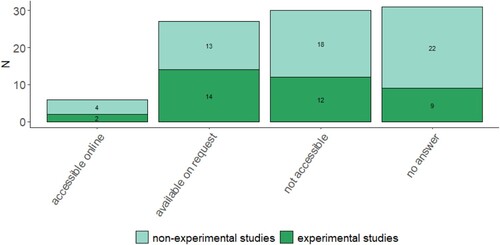
Figure 3. Geographical distribution of studies by country.
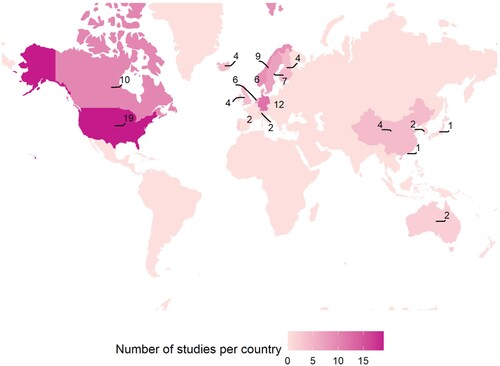
Figure 4. Effect of technical determinants on BEV acceptance.
Note: This figure summarises reporting results on the respective facilitators of BEV acceptance. The effect direction indicates the number of studies reporting significant effects (“negative”,< “b>positive”) or non-significant effects (“none”) on BEV acceptance. Color-codes indicate experimental or non-experimental study design.
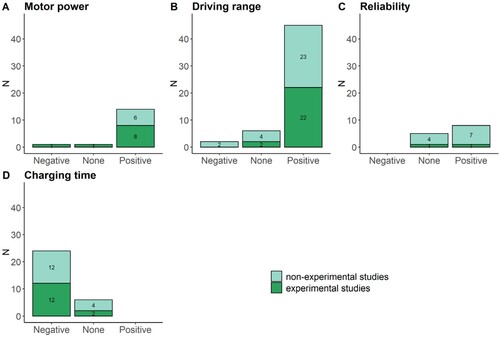
Figure 5. Effect of contextual determinants on BEV acceptance.
Note: This figure summarises reporting results on the respective facilitators of BEV acceptance. The effect direction indicates the number of studies reporting significant effects (“negative”,< “b>positive”) or non-significant effects (“none”) on BEV acceptance. Color-codes indicate experimental or non-experimental study design.
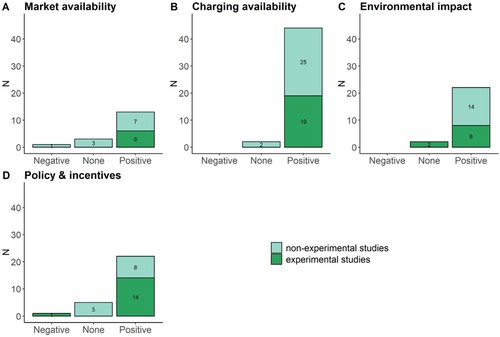
Figure 6. Effect of cost determinants on BEV acceptance.
Note: This figure summarises reporting results on the respective facilitators of BEV acceptance. The effect direction indicates the number of studies reporting significant effects (“negative”,< “b>positive”) or non-significant effects (“none”) on BEV acceptance. Color-codes indicate experimental or non-experimental study design.
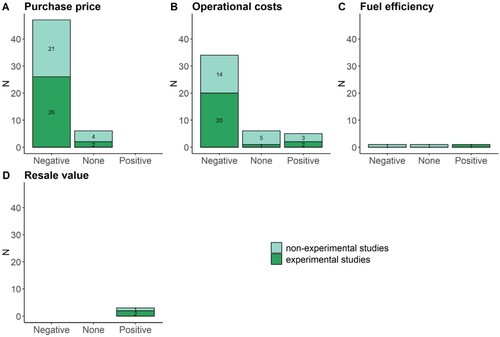
Figure 7. Effect of sociodemographic attitudes on BEV acceptance.
Note: This figure summarises studies reporting results on the respective facilitators of BEV acceptance. The effect direction indicates the number of studies reporting significant effects (“negative”,< “b>positive”) or non-significant effects (“none”) on BEV acceptance. For gender, female was chose as the baseline category thus indicating that, for example, negative effects mean that females have lower BEV acceptance. Color-codes indicate experimental or non-experimental study design.
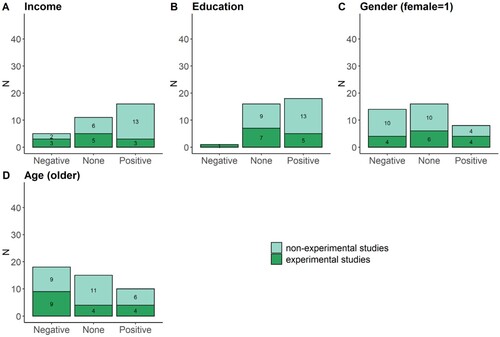
Figure 8. Effect of individual attitudes and behaviour on BEV acceptance.
Note: This figure summarises reporting results on the respective facilitators of BEV acceptance. The effect direction indicates the number of studies reporting significant effects (“negative”,< “b>positive”) or non-significant effects (“none”) on BEV acceptance. For example, technology-affine individuals (“positive”) have a higher BEV acceptance. Color-codes indicate experimental or non-experimental study design.
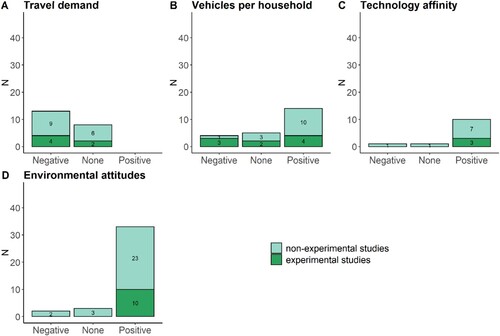
Figure 9. Effect of BEV-specific experience on BEV acceptance.
Note: This figure summarises reporting results on the respective facilitators of BEV acceptance. The effect direction indicates the number of studies reporting significant effects (“negative”,< “b>positive”) or non-significant effects (“none”) on BEV acceptance. Color-codes indicate experimental or non-experimental study design.
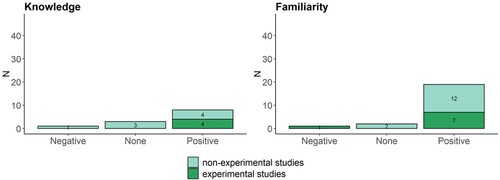
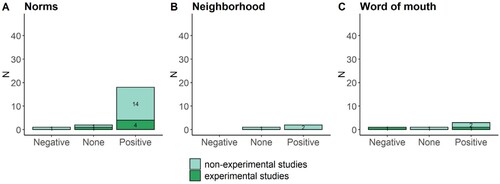
Figure 10. Effect of social determinants on BEV acceptance.
Note: This figure summarises reporting results on the respective facilitators of BEV acceptance. The effect direction indicates the number of studies reporting significant effects (“negative”,< “b>positive”) or non-significant effects (“none”) on BEV acceptance. Color-codes indicate experimental or non-experimental study design.