
Figures & data
Figure 1. Summary of the comprehensive search procedure (source: authors analysis).
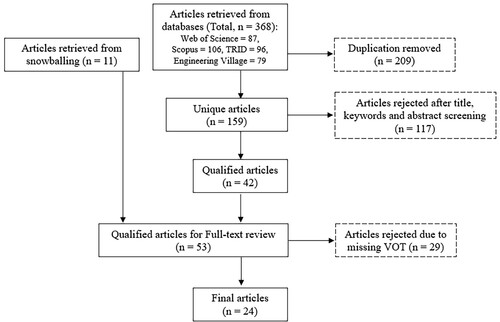
Figure 2. Box plot distribution of the estimated VOT for different types of vehicle.
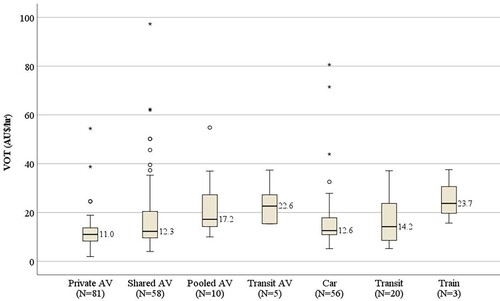
Table 1. Difference in VOT (in %) among vehicle categories (row minus column) .
Table 2. Variation of mean VOT (AU$/hr) between vehicle types and different variables.
Table 3. Statistical t-test results of the mean VOT difference between different variables and their individual categories.
Figure 3. VOT distribution classed by AV demonstration approach.
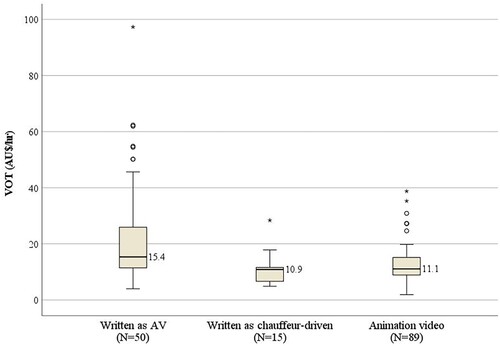
Table 4. Factors influencing the VOT estimates for AV travel.
Table A1. Studies along with their major characteristics included in the meta-analysis (ordered by year of publication).