
Figures & data
Figure 1. Systematic search process based on the PRISMA framework and search outcomes (Page et al., Citation2021).
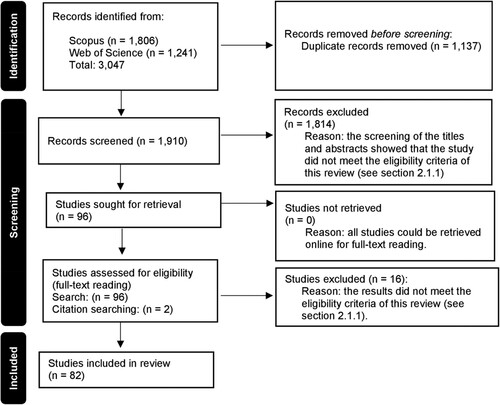
Table 1. Indicators used to extract data for each built environment dimension.
Table 2. Quantitative impacts of AVs on parking.
Table 3. Quantitative impacts of AVs on residential and employment densities.
Table 4. Quantitative impacts of AVs on destination accessibility.
Table 5. Quantitative impacts of AVs on distance to central business district.
Figure 2. Built Environment Impacts for Central Business Districts. SAVs, PAVs, SAVs + PAVs.
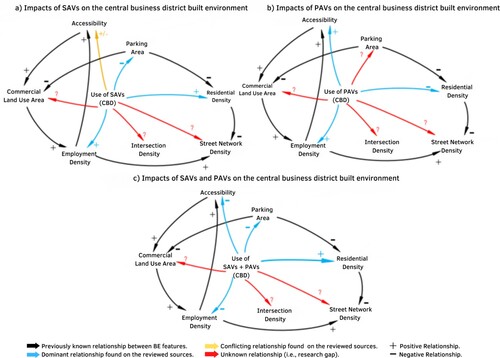
Figure 3. Built Environment Impacts for Suburbs. SAVs, PAVs, SAVs + PAVs.
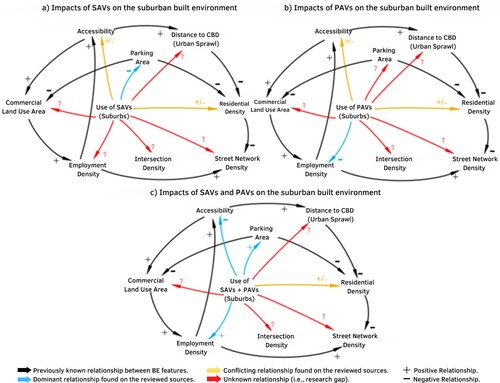
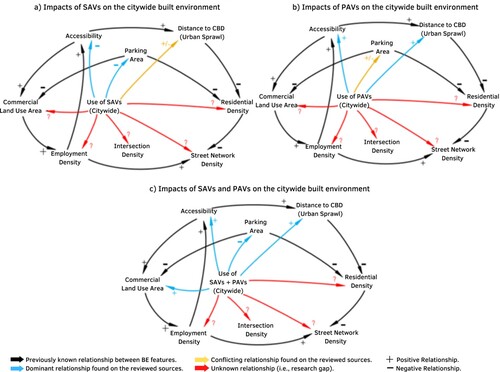
Figure 4. Citywide Built Environment Impacts. SAVs, PAVs, SAVs + PAVs.
Supplemental material