Figures & data
Figure 1. Adapted from Baumgartner et al. (Citation2009).
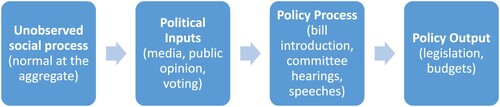
Figure 2. Total mail per fortnight.
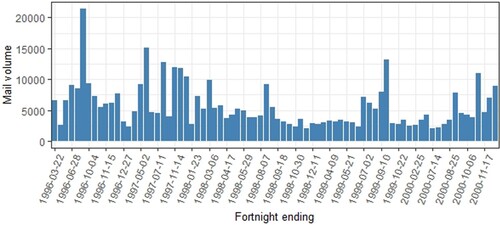
Table 1. Top topics of the letters.
Figure 3. Mr Howard’s fortnightly mail – with normal curve and 3 standard deviations indicated.
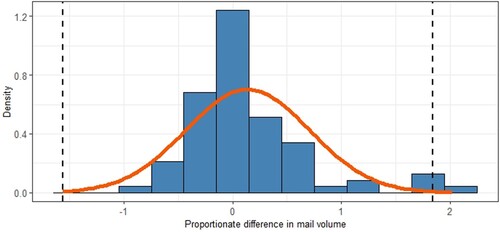
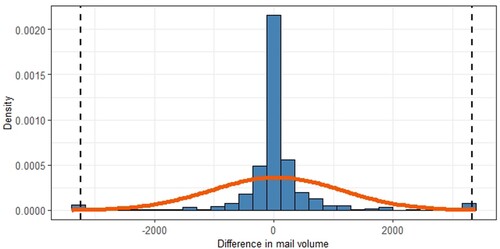
Figure 4. Weekly presidential mail volume: Ford to Reagan (with normal curve and 3sd indicated).
Note: for ease of visualization, all observations beyond 3sd were aggregated at 3sd.
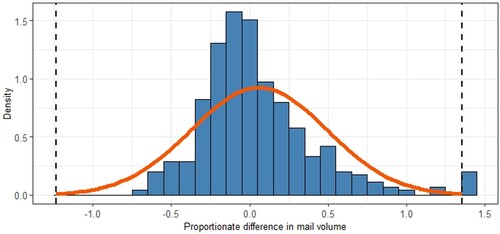
Table 2. Summary of Kurtosis and L-kurtosis for changes in mail volumes.
Figure 5. Mr Howard's fortnightly mail – change in topics (pooled).
Note: for ease of visualisation, all observations beyond 3sd were aggregated at 3sd.