
Figures & data
Table 1. Sampled documents.
Table 2. Multinomial logistic regression model of the IO coverage of countries.
Table 3. IO coverage of countries by regional affiliation in percentage.
Table 4. Descriptive statistics on the references in the OECD and World Bank reports.
Figure 1. Reference frequency over time with reform frequency.
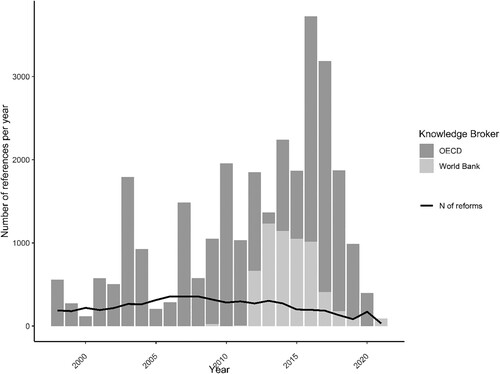
Figure 2. Reference coverage of the OECD and the World Bank. Note. The dotted countries were not referenced at all by either IO.
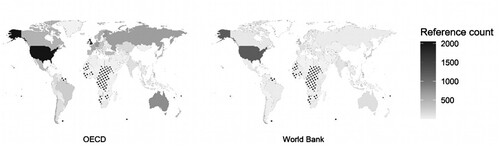
Figure 3. Predicted probabilities of references in IO reports.
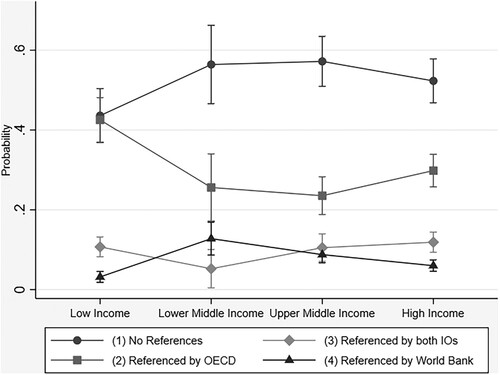
Table A1. Multinomial regression model of policy references in IO reports.