
Figures & data
Table 1. Multilevel hierarchical regression model with Indigenous/non-Indigenous status predicting motivation and engagement.
Figure 1. Positive and negative motivation and engagement predicting educational outcomes for Indigenous students, controlling for age, gender, SES, and prior achievement. *p < .05, **p < .01, and ***p < .001, ns: not statistically significant. Note 1. Unstandardised coefficients are shown; Note 2. L1 and L2 are random variance estimates; Note 3. Dashed lines represent non-significant (p > .05) parameters.
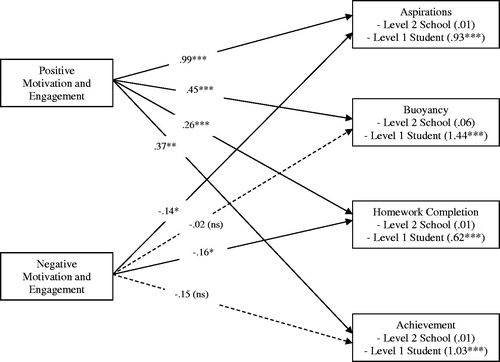
Table 2. Multilevel regression model predicting external correlates for Indigenous students.
Supplemental material