

Figures & data
Table 1. Baseline patient and fibroid characteristics.
Table 2. Effect of the cardiac cycle and different gain settings on Vascular Index (VI) measured with 3D power Doppler ultrasound in patients with fibroids (N = 40).
Figure 1. Vascular Index (VI)* in fibroids calculated from two consecutive 3D power Doppler sweeps in the same patient #. *VI was measured using VOCAL software (manual contour mode, histogram function). #Little difference can be observed between two consecutive measurements. Only in a few individuals, all with a high VI, large differences can be observed.
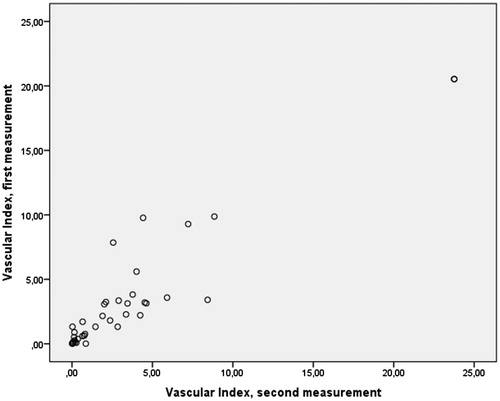
Figure 2. 3D power Doppler image: well vascularised fibroid, moderate peripheral penetration.
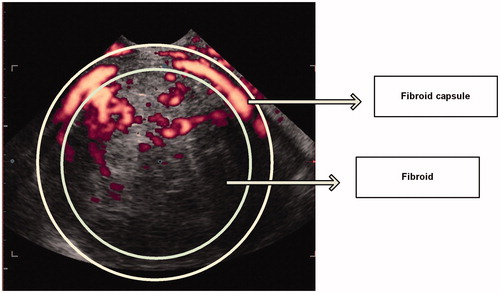
Figure 3. 3D power Doppler image in VOCAL: oval fibroid with vascular capsule, good peripheral penetration.
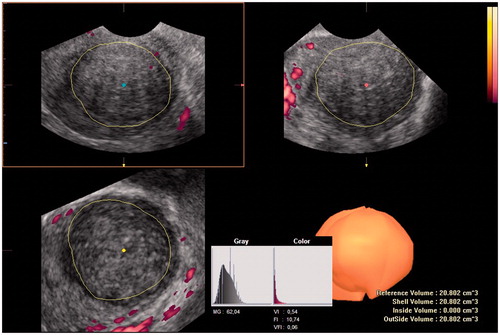
Table 3. Observer preferenceTable Footnotea for type of volume measurement in fibroids using 3D power Doppler ultrasound and VOCAL software.
Table 4. Shell size preferenceTable Footnotea in measuring vascular indices using 3D power Doppler ultrasound and VOCAL software for the capsule of the fibroidTable Footnoteb.