Figures & data
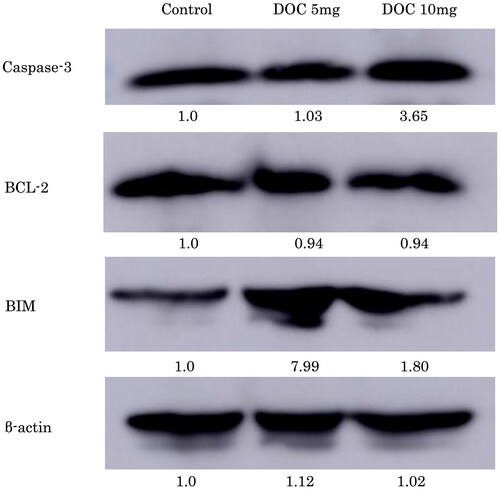
Figure 1. DOC affects ovary weight but not the number of oocytes after superovulation is induced in mice. (A) Ovary weight. (B) Number of oocytes after superovulation was induced in the control (PBS, n = 12), DOC-5 (5 mg/kg DOC, n = 10), and DOC-10 (10 mg/kg DOC, n = 10) groups. Data are expressed as mean ± SEM. * indicates P < 0.05 when data for the DOC-treated groups are compared to those for the control group. PBS: phosphate-buffered saline; SEM: standard error of the mean.
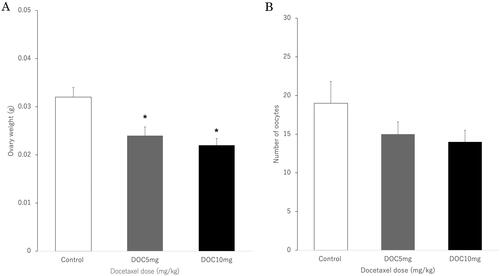
Figure 2. Hematoxylin and eosin staining of ovaries (×40 magnification). (A) Control group of ovaries showing normal morphology. (B) DOC-5 (5 mg/kg DOC) and (C) DOC-10 (10 mg/kg DOC) groups demonstrating reduced follicular numbers at each stage. PF; primary follicle, SF; secondary follicle, TF; tertiary follicle. DOC affects the number of secondary follicles and the total number of follicles but not primordial, primary, or tertiary follicles. Number of (D) primordial, (E) primary, (F) secondary, and (G) tertiary follicles. (H) Total number of follicles in the control (n = 12), DOC-5 (5 mg/kg DOC, n = 10), and DOC-10 (10 mg/kg DOC, n = 10) groups. The data show significant decreases in the number of secondary follicles and the total number of follicles in the DOC-10 group. Data are expressed as mean ± SEM. * indicates P < 0.05 when the data for the DOC-treated groups are compared to those for the control group.
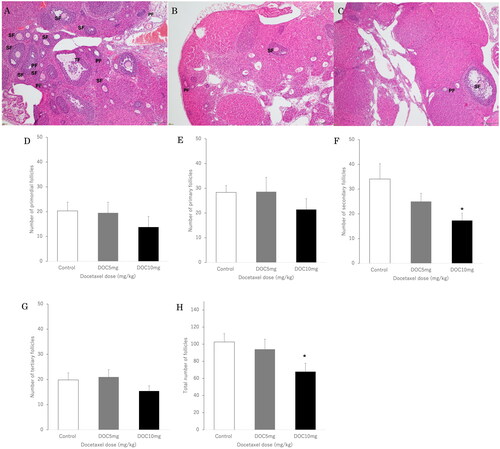
Figure 3. DOC increases caspase-3 and BIM expression but not BCL-2 expression in mice. Representative images showing western blotting of whole ovary proteins for caspase-3, BCL-2, and BIM expression in the control, DOC-5 (5 mg/kg DOC) and DOC-10 (10 mg/kg DOC) groups. Six ovaries were analysed for each treatment group. The data presented were normalised against those for the PBS-treated group.