

Figures & data
Figure 1. A summary of the literature search and study identification process.
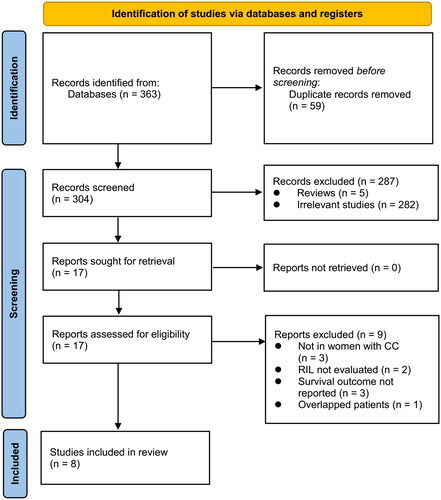
Table 1. Study characteristics.
Table 2. Study quality evaluation via the Newcastle-Ottawa Scale.
Figure 2. Forest plots for the meta-analyses regarding the association between RIL and OS in women with CC. A, overall meta-analysis; and B, subgroup analysis according to grade of RIL.
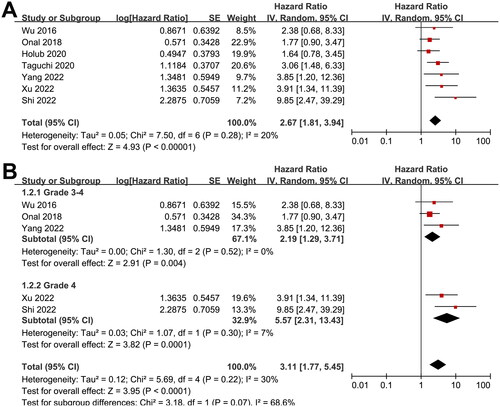
Figure 3. Forest plots for the subgroup-analyses regarding the association between RIL and OS in women with CC. A, subgroup analysis according to the timing of RIL diagnosis; and B, subgroup analysis according to the study quality scores.
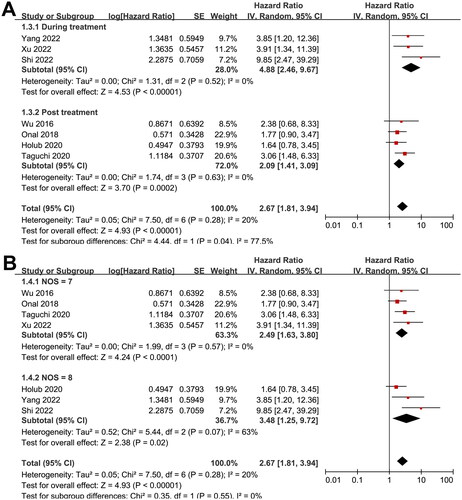
Figure 4. Forest plots for the meta-analyses regarding the association between RIL and PFS in women with CC. A, overall meta-analysis; and B, subgroup analysis according to grade of RIL.
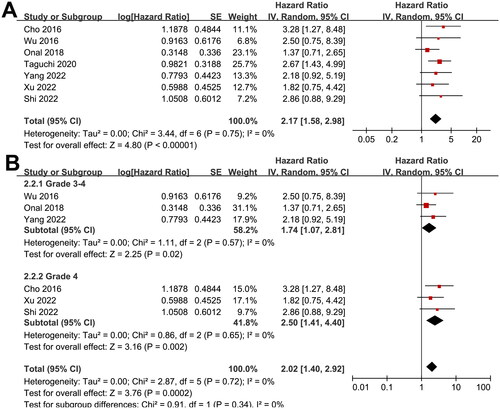
Figure 5. Forest plots for the subgroup-analyses regarding the association between RIL and PFS in women with CC. A, subgroup analysis according to the timing of RIL diagnosis; and B, subgroup analysis according to the study quality scores.
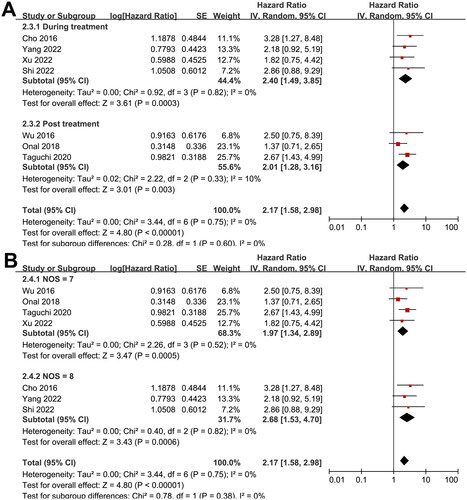
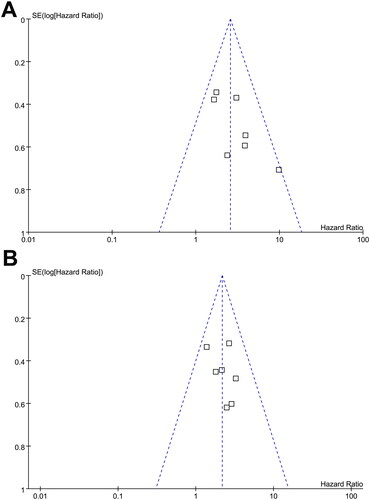
Figure 6. Funnel plots for the publication bias underlying the meta-analyses; A, funnel plots for the meta-analysis of OS; and B, funnel plots for the meta-analysis of PFS.
Supplemental Material
Download MS Word (17.1 KB)Data availability statement
All data used in this paper are from published articles.