

Figures & data
Figure 1. UmA level is increased in sPE patients. UmA level in urine samples of sPE patients and healthy controls was measured by means of ELISA. Data were described as mean ± standard deviation. The independent sample t test was applied to compare the difference between groups. **p < 0.01.
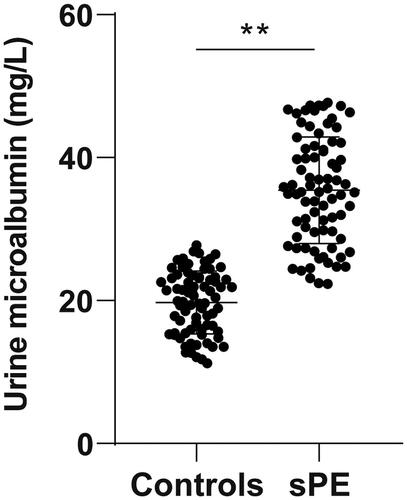
Figure 2. UmA level is positively correlated with ultrasonic parameters of UA PI and RI in the urine of sPE patients. The correlation between (A) PI and UmA levels and between (B) RI and UmA levels in sPE patients was analysed by Pearson’s co-efficient analysis.
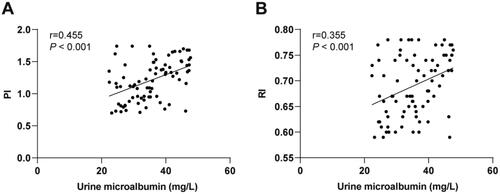
Table 1. Adverse pregnancy outcomes of sPE patients and healthy controls.
Table 2. Comparison of adverse pregnancy outcomes between the high UmA expression group and low UmA expression group.
Table 3. Logistics multivariate regression analysis of adverse pregnancy outcomes of sPE patients.