

Figures & data
Figure 1. Flowchart for study population inclusion. OGTT: oral glucose tolerance test; GWG: gestational weight gain.
Inadequate GWG group: Weight gain during pregnancy is below the recommended range.
Adequate GWG group: Weight gain during pregnancy is in the recommended range.
Excessive GWG group: Weight gain during pregnancy is above the recommended range.
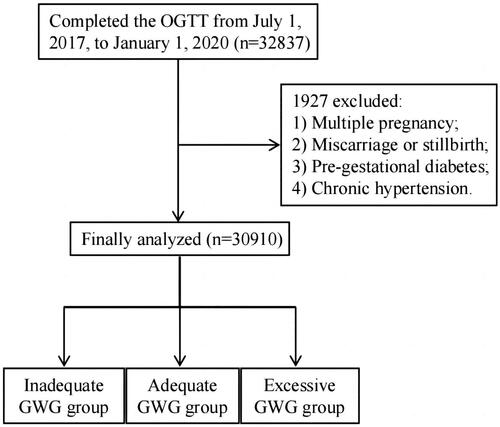
Table 1. Baseline characteristics and pregnancy outcomes in pregnant women with different GWG.
Figure 2. The association between GWG and adverse pregnancy in women with and without GDM. A categorical variable is expressed as n (%). GWG: gestational weight gain; GDM: gestational diabetes mellitus; SGA: small for gestational age; LGA: large for gestational age. **P < 0.01, P values were calculated using Chi-square test, compared with GDM positive women.
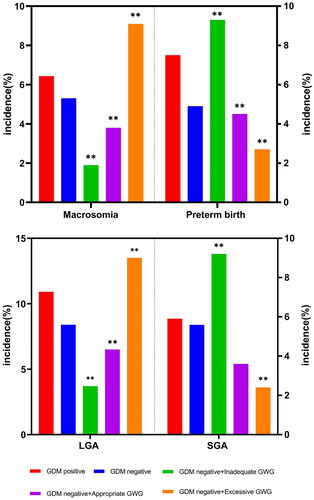
Table 2. Relative risks of adverse pregnancy outcomes in no GDM women according to different GWG.
Table 3. Subgroup analysis based on pp-BMI.
Data availability statement
The datasets used and analysed during the current study are available from the corresponding author on reasonable request.