

Figures & data
Figure 1. Flowchart for the study (Established the ICP and the normal model. Collected liver and serum. Analysed the expression of InsP3R in liver of the model. Analysed the levels of serum Ca2+, glycocholic acid and bile acid in serum of the model. Analysed the correlation between the level of Ca2+ and the levels of glycocholic acid and bile acid.).
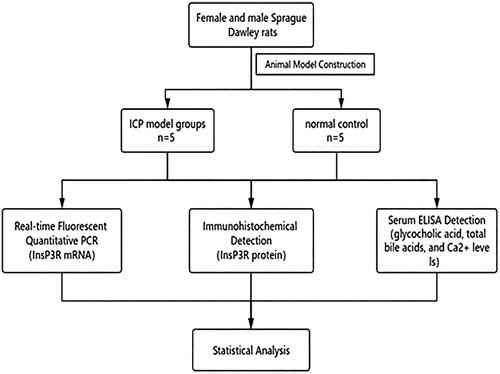
Figure 2. qPCR analysis of InsP3R mRNA expression. (A) Results of PCR amplification. (B) InsP3R mRNA relative expression of control group and model group. *InsP3R mRNA expression in the model group was significantly lower compared with the control/normal group (p < .05).
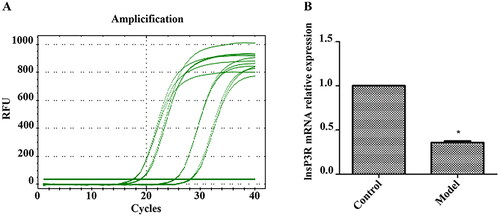
Figure 3. Immunohistochemistry analysis of InsP3R protein expression. (A) Images of immunohistochemistry. (B) Relative expression of lnsP3R protein in each group. *Expression of InsP3R in the model group was significantly lower compared with the control/normal group (p < .05).
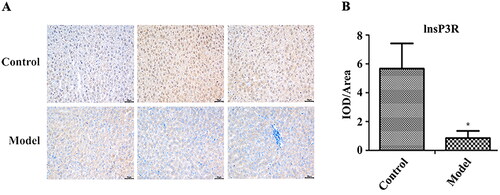
Figure 4. Correlation between glycocholic acid, total bile acids and calcium ion. CG: glycocholic acid; TBA: total bile acids.
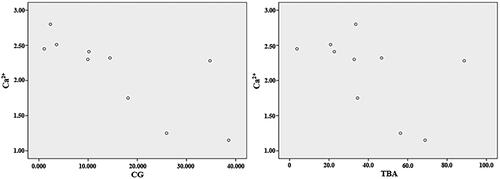
Table 1. Comparison of ELISA indexes (x ± s).
Data availability statement
All generated raw data and/or analysed data from the current study are available from the corresponding author on reasonable request.