

Figures & data
Figure 1. Molecular structure of AS.
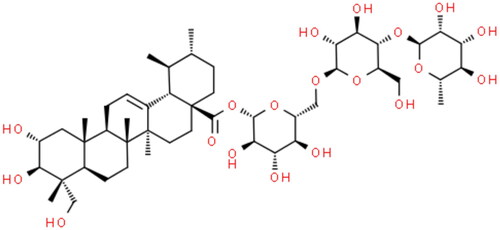
Figure 2. AS promoted cell proliferation in cell model of GDM. (A) Cytotoxicity assay of AS with different concentrations and treatment times, (B) Cell proliferation in GDM cell model with AS treatment.
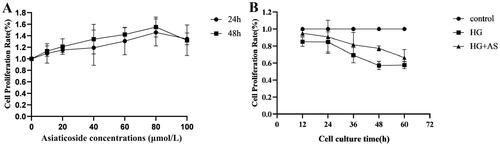
Figure 3. AS promoted cell migration in cell model of GDM. *p < 0.05 compared with control group; #p < 0.05 compared with HG group.
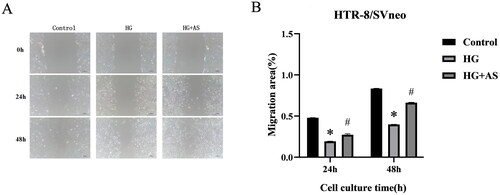
Figure 4. Effect of AS on mRNA levels of signalling molecules in PI3K/AKT pathway. *p < 0.05 compared with control group; #p < 0.05 compared with HG group.
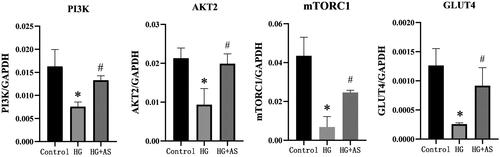
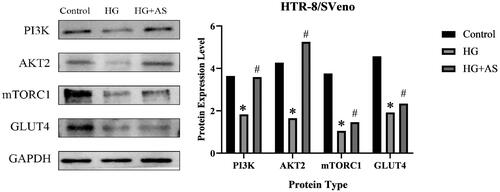
Figure 5. Effect of AS on protein expressions of signalling molecules in PI3K/AKT pathway. *p < 0.05 compared with control group; #p < 0.05 compared with HG group.
Data availability statement
The data supporting our findings are available from the corresponding author upon request.