

Figures & data
Figure 1. Based on the study flowchart, 138 were included in this retrospective analysis. The patients were divided into a recurrence group and non-recurrence group based on the recurrence after treatment. IDBC: invasive ductal breast cancer.
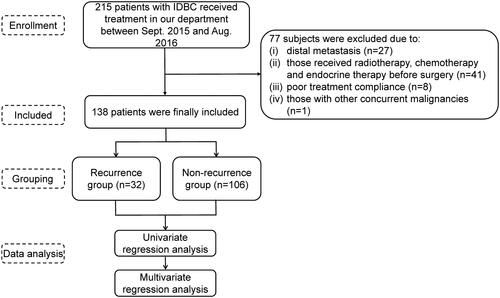
Table 1. Univariate and multivariate regression analysis results for recurrence.
Figure 2. Prediction nomogram for the 3-yr and 5-yr DFS using ALDH1, p-AKT, and pathological stages in BC patients (A). Calibration curve and ROC curve of the nomogram for predicting DFS in BC patients (B). (a, b) The consistence of predicted 3-yr and 5-yr DFS and the actual 3-yr and 5-yr DFS. (c) The AUC calibration plot. Kaplan-Meier curves for the DFS of BC patients after PI-based stratification (C). DFS: disease-free survival; ALDH1: aldehyde dehydrogenase 1; ROC: receiver operating characteristic; BC: breast cancer; AUC: area under the ROC curve.
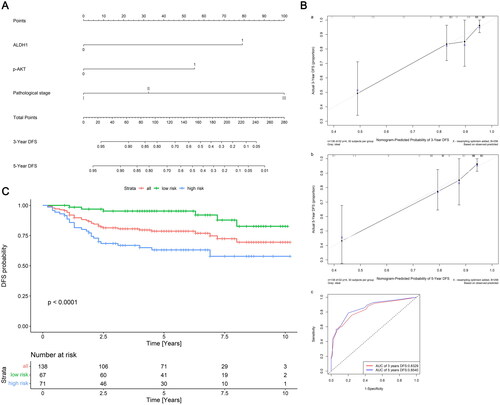
Table 2. Univariate and multivariate regression analysis results for mortality.
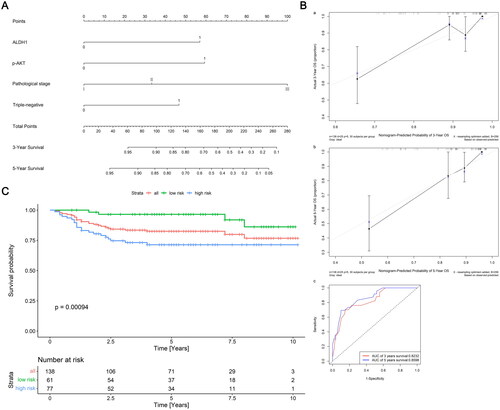
Figure 3. Prediction nomogram for the 3-yr and 5-yr OS using ALDH1, p-AKT, pathological stages and ER-/PR-/HER2- in BC patients (A). Calibration curve and ROC of the nomogram for OS in BC patients (B). (a, b) The consistence of predicted 3-yr and 5-yr OS and the actual 3-yr and 5-yr OS. (c) AUC calibration plot. Kaplan-Meier curves for the OS of BC patients after pi-based mortality stratification (C). OS: overall survival; ALDH1: aldehyde dehydrogenase 1; ROC: receiver operating characteristic; BC: breast cancer; AUC: area under the ROC curve; ER: oestrogen receptor; HER2: human epidermal growth factor receptor 2; PR: progesterone receptor.
Data availability statement
The data that support the findings of this study are available from the corresponding author upon reasonable request.