

Figures & data
Figure 1. Weighted gene co-expression network analysis and screening of hub gene. (A) Clustering diagram of gene modules; (B) heat map of correlation analysis between gene modules and phenotypes: age(age), length(maximum diameter length of tumour), stage(tumour stage), grade(pathological grading), lymph (whether there is lymphovascular invasion), metastasis(whether there is distant metastasis), and type(whether it is cancer or not). (C) Screening candidate genes in blue module, the thresholds are MMS > 0.75 and GS > 0.5. D: Screening candidate genes in turquoise module, the thresholds are MMS > 0.8 and GS > 0.8. E: Multivariate COX regression analysis for genes with P < 0.05 after univariate COX regression analysis. * P < 0.05, ** P < 0.01, *** P < 0.001.
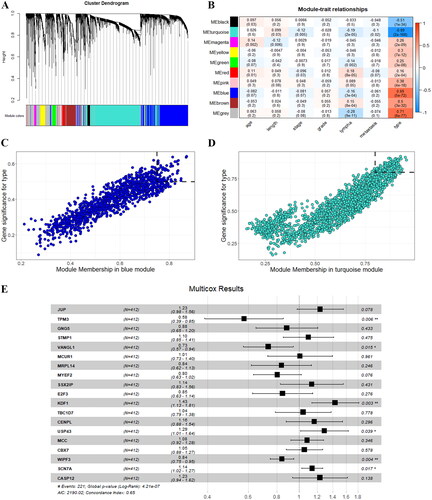
Figure 2. Validation of the hub gene USP43. (A) USP43 mRNA expression in different data sets. (E) Immunohistochemistry of USP43 protein in normal ovarian tissues and ovarian cancer tissues. (F) Overall survival of USP43 high and low expression groups. (G) Disease-specific survival of USP43 high and low expression groups. * P < 0.05, ** P < 0.01, *** P < 0.001.
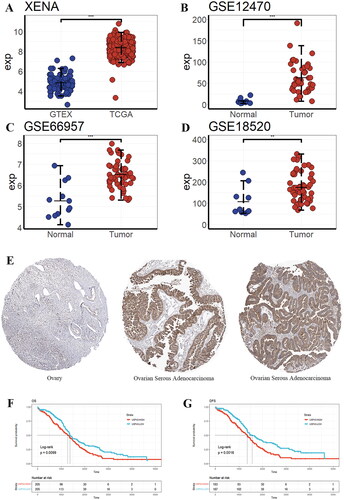
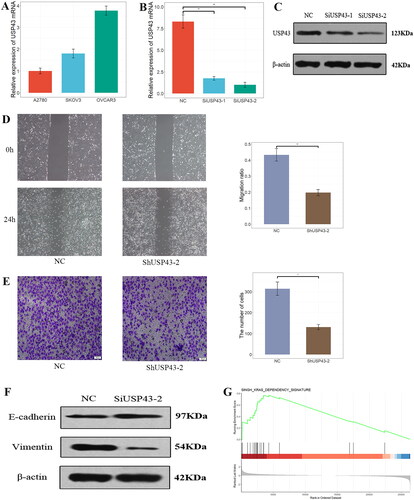
Figure 3. USP43 Promotes Ovarian Cancer Cell Migration and Invasion through epithelial-mesenchymal transformation. (A) Expression of USP43 mRNA in different cell lines. (B,C) Interference efficiency of different groups after RNAi interference; (D) USP43 promotes OVCAR3 cell migration; (E) USP43 promotes OVCAR3 cell invasion; (F) Western blot of expression of epithelial mesenchymal transition marker protein after interference with USP43. (G) Gene Set Enrich Analysis results of USP43-related genes. * P < 0.05,** P < 0.01,*** P < 0.001.
Supplemental Material
Download Zip (3.4 MB)Data available statement
All of data this study used were obtained from open access database. The data generated after analysing in present study are available from the corresponding author on reasonable requests.