

Figures & data
Figure 1. Strengthening the reporting of observational studies in epidemiology (STROBE).
Flow diagram of patients recruitment.
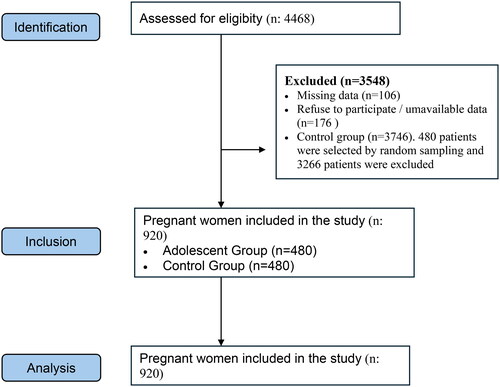
Table 1. Demographic data of pregnant adolescents and the control group with comparisons of education level, marital status, and smoking by groups.
Table 2. Infants’ APGAR scores measured at the 5th minute after birth were similar between the groups.
Table 3. Maternal and foetal outcomes of pregnant adolescents and the control group.
Table 4. Risk levels of pregnant adolescents in terms of adverse pregnancy outcomes and conditions.
Data availability statement
The data supporting the findings of this study are available from the corresponding author upon reasonable request.