

Figures & data
Figure 1. Flow chart of the study. CS: caesarean section; N: number; VD: vaginal delivery.
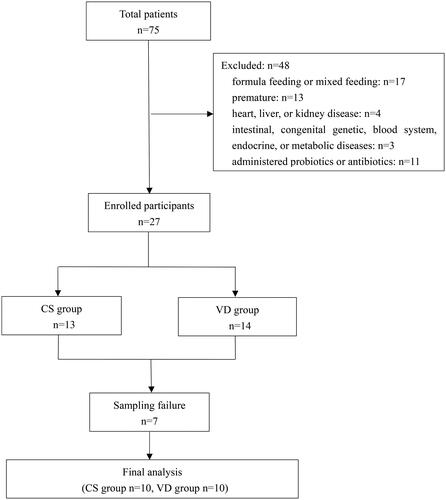
Table 1. Characteristics of infants included in the study.
Figure 2. Gut microbial alpha diversity and beta diversity in the CS (A) and VD (B) groups.Ace: abundance based coverage estimator; PC: principal component; PCoA: principal co-ordinates analysis. (a) Distribution of ace estimator, (b) Distribution of Simpson’s diversity index, (c) Principal coordinate analysis based on weight, (d) Weighted UniFrac metrics of faecal samples in the two groups.
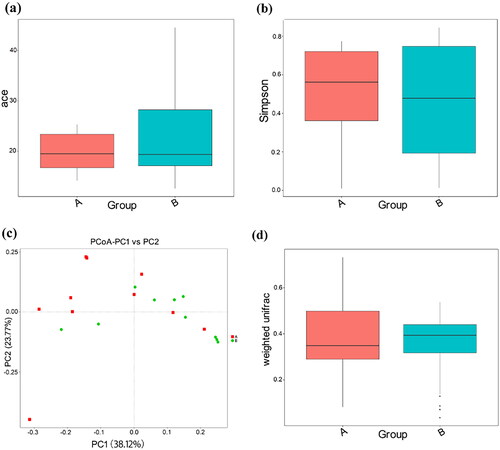
Table 2. Adonis analysis based on the Bray-Curtis.
Figure 3. Diagram of species differences between groups according to t-test at phylum (a) and family (b) levels. A: CS group, B: VD group.
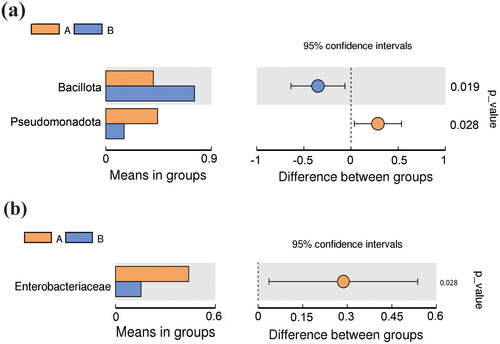
Table 3. Relative abundance of dominant bacterial taxa in the CS and VD groups.
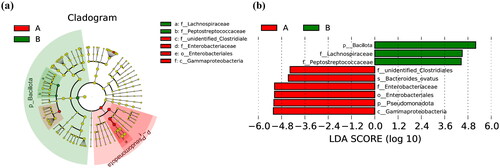
Figure 4. Cladogram plot (a) and linear discriminant analysis (LDA) score plot (b) from LDA effect size algorithm (LEfSe) analysis of the intestinal microbiota composition in the CS (A) and VD (B) groups. Concentric rings from inside to outside represent phylum, class, order, family, and genus, in order. The red circle represents biomarkers in group A, and the green circle represents biomarkers in group B. LEfSe identifies the most differentially abundant taxa between the two groups. Enriched taxa in group A are indicated with a positive LDA score (red), and enriched taxa in group B have a negative score (green). The taxa that meet the LDA significant threshold exceeding four are shown. The length of the histogram represents the impact of different species (LDA score). A: CS group, B: VD group. LDA: linear discriminant analysis.
Supplemental Material
Download TIFF Image (14.3 MB)Supplemental Material
Download TIFF Image (352.2 KB)Data availability statement
The datasets that support the findings of the current study are available from the corresponding author upon reasonable request.