

Figures & data
Figure 1. Flow diagram for the selection of studies and specific reasons for exclusion from the present meta-analysis.
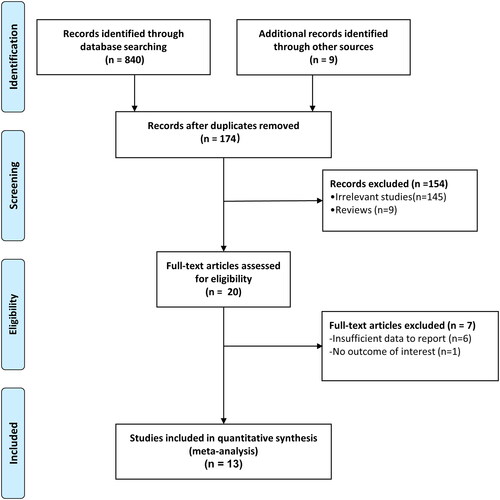
Table1. Characteristics of the included studies comparing pregnancy outcomes of foetal reduction from twin to singleton gestation compared to ongoing twin gestations.
Table 2. Quality assessment of the included studies based on Newcastle-Ottawa Scale (NOS).
Figure 2. Forest plot for the association of diabetes mellitus between foetal reduction from twin to singleton gestation and control group.
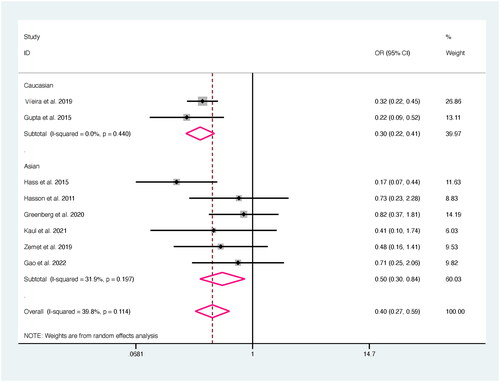
Figure 3. Forest plot for the association of hypertension between foetal reduction from twin to singleton gestation and control group.
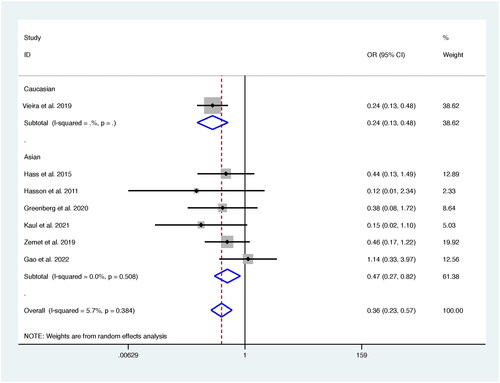
Figure 4. Forest plot for the association of caesarean between foetal reduction from twin to singleton gestation and control group.
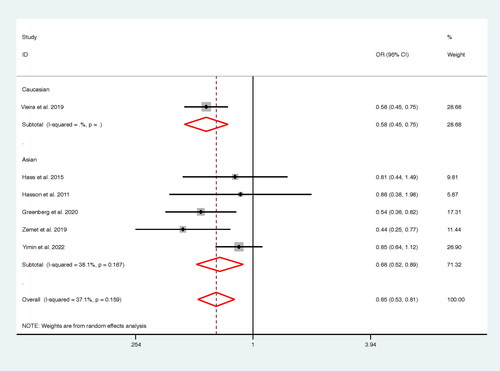
Figure 5. Forest plot for the association of foetal loss between foetal reduction from twin to singleton gestation and control group.
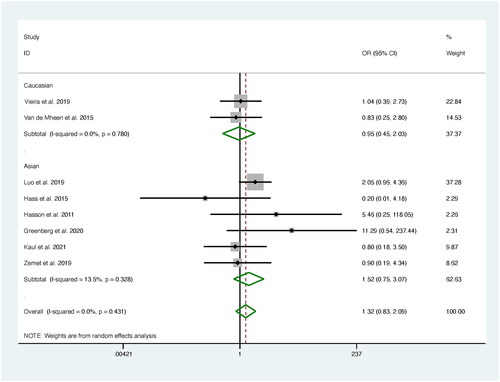
Figure 6. Funnel plot for the association of (a) diabetes mellitus, (b) hypertension, (c) caesarean delivery and (d) foetal loss between foetal reduction from twin to singleton gestation and control group.
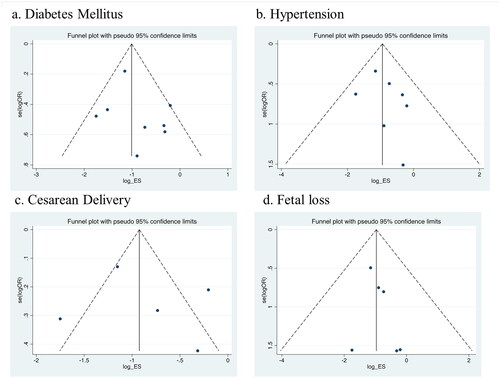
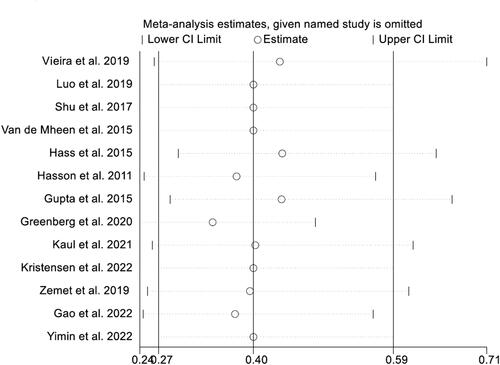
Figure 7. Sensitivity analysis for the association of diabetes mellitus between foetal reduction from twin to singleton gestation and control group.
Supplemental Material
Download PDF (1 MB)Data availability statement
The data that support the findings of this study are available from the corresponding author upon reasonable request.