

Figures & data
Figure 1. Flow chart for inclusion/exclusion of EC patients.
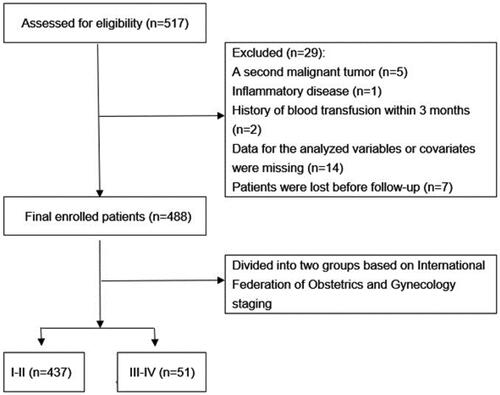
Figure 2. ROC curves of the SII, NLR, MLR, PLR, PDW, and CA125 levels in predicting EC stage. ROC: receiver operating characteristic; SII: systemic immune-inflammation index; NLR: neutrophil-to-lymphocyte ratio; MLR: monocyte-to-lymphocyte ratio; PLR: platelet-to-lymphocyte ratio; PDW: platelet distribution width; CA125: cancer antigen 125.
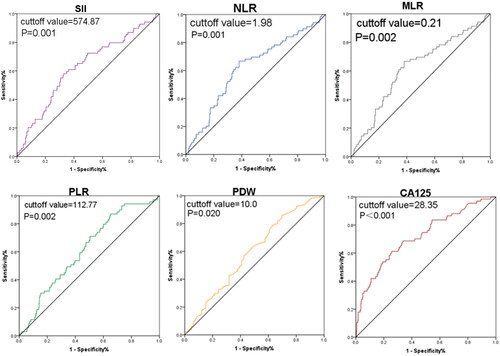
Table 1. Comparison of clinical indicators in early and advanced EC.
Table 2. Univariate and multivariate logistic regression analyses for EC stage.
Table 3. Associations of PDW and CA125 level with clinical characteristics.
Figure 3. Kaplan–Meier curve for OS of patients with EC stratified by PDW and CA125. (A) Kaplan-Meier curve for OS in EC patients in different PDW + CA125 groups (0 vs 1 vs 2). (B) Kaplan-Meier curve for OS in EC patients in different PDW + CA125 groups (0 and 1 vs 2).
PDW: platelet distribution width; CA125: cancer antigen 125. High PDW + low CA125 = 0 points; either low PDW or high CA125: 1 point; both low PDW and high CA125: 2 points.
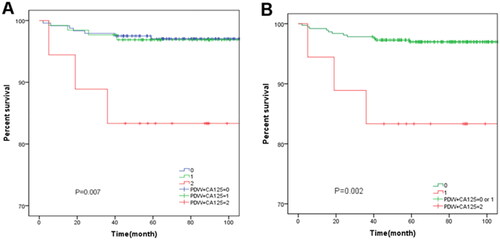
Table 4. Univariate and multivariate Cox proportional hazards regression analyses for OS in EC.
STROBE_checklist.doc
Download MS Word (111 KB)Certificate of editing 2.pdf
Download PDF (299.1 KB)Certificate of editing 1.pdf
Download PDF (304.3 KB)Data availability statement
The datasets used and/or analysed during the current study are available from the corresponding author on reasonable request.