
Figures & data
Table 1. Case comparison.
Table 2. Method of data collection.
Table 3. Respondents Bilateral.
Table 4. Respondents Multiparty.
Figure 1. Fruchterman-Reingold visualization of the project network in case Bilateral.
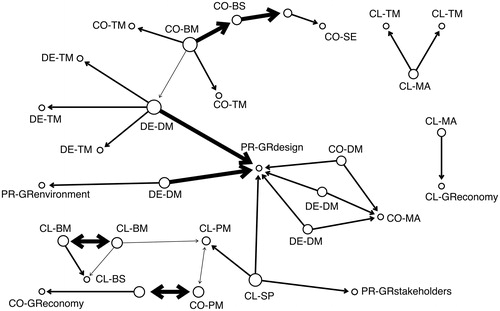
Figure 2. Fruchterman-Reingold visualization of the project network in case Multiparty. In order to ensure readability, tables and figures are provided as separate files.
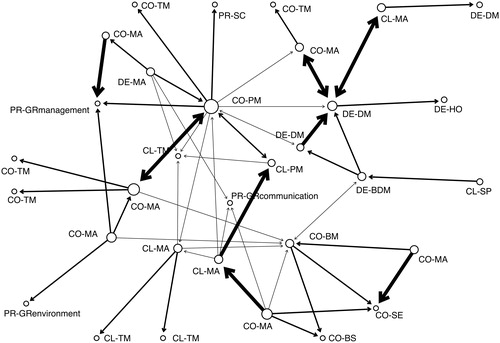
Table 5. Empirical findings.