
Figures & data
Figure 1. The average number of employees in contracting firms in different forms of ownership (Source: National Bureau of Statistics of China Citation2016).
A line graph from 1980 to 2015 showing the rapid reduction in the average number of employees in state-owned contracting firms. Also shows the relative stability in the average number of employees for collective-owned contracting firms, and for those in other forms of ownership.
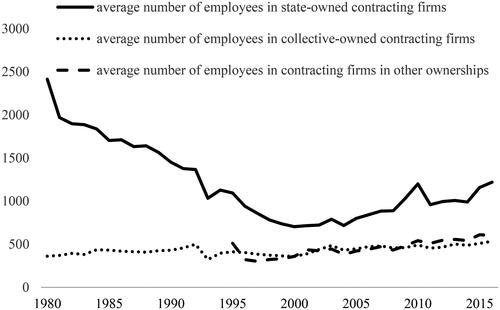
Table 1. Summary details of interviewees.