
Figures & data
Figure 1. Methodological steps in the Formative Scenario Analysis (FSA). Adapted from (Scholz and Tietje Citation2002).
The seven main steps taken in this study are listed on the left and associated with their respective sub-steps with arrows. On the right, the outputs from this study are listed and associated with the steps with arrows.
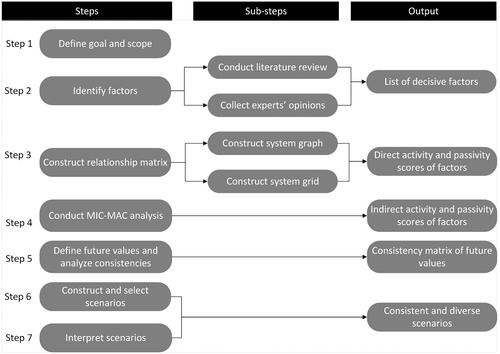
Table 1. List of experts that participated in the study.
Table 2. Consistency ratings
Figure 2. The scenario selection process.
The scenario selection process is shown as a chain of events with two main boxes. The first box is titled the bottom-up approach and shows three main steps taken to filter scenarios. The second box is titled the top-down approach and shows one major step taken to select the three scenarios.
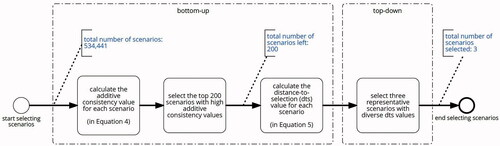
Table 3. The decisive set of industrialised construction adoption factors identified.
Figure 3. System graph of factors.
The relationship between the 19 factors is shown using two types of lines. The first type of line represents a strong relationship, and the second a lighter relationship between the factors. Each of the 19 factors is listed twice to show the impact other factors have on it and its impact on others.
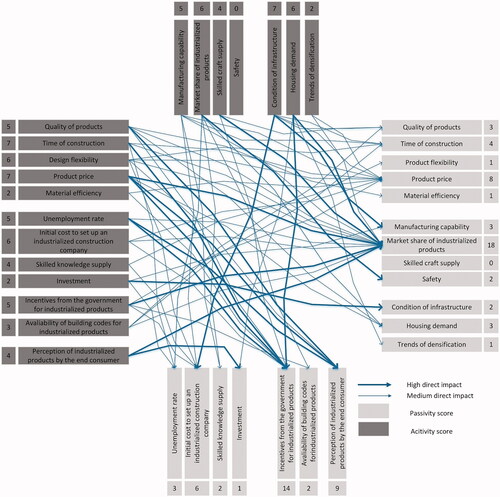
Figure 4. System grid of factors.
The 19 factors are plotted in a grid format. There are four sections in the grid labelled active, passive, buffering, and ambivalent. The 19 factors are shown in the quadrant they belong.
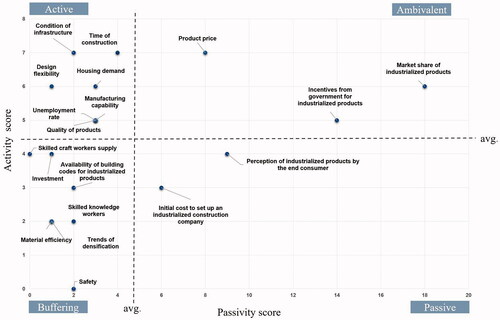
Table 4. Current and future values of factors.
Table 5. Selected scenarios and future values of factors.
Figure A1. relationship matrix of factors (0=no or very little direct impact, 1= medium direct impact, 2 = high direct impact.)
Factors are listed vertically and horizontally in a tabular form. The intersection point between any two factors is assigned a value indicating the strength of impact unless they are identical.
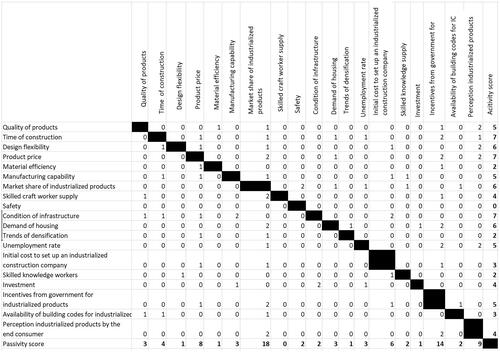
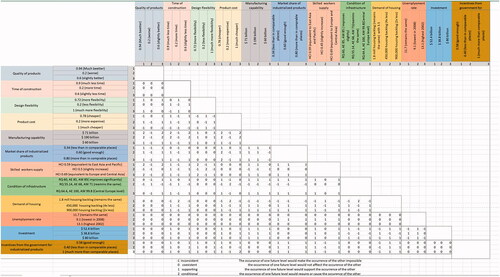
Figure A2. Consistency matrix of factors.
Factors are listed vertically and horizontally in a tabular form. The potential three future values are listed next to each factor. The intersection point between any two future values is assigned a consistency rating value unless they are identical.
Supplemental material