Figures & data
Figure 1. Organisational chart of the STA. Departments included in the study are coloured in grey.
An image of the organisational structure of the Swedish Transport Administration. The figure shows the central and operational departments and the project level. The Purchasing and Logistics department and the projects are coloured grey.
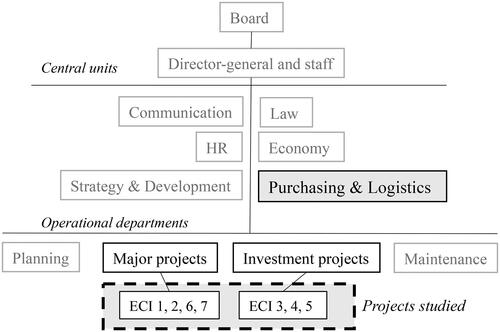
Table 1. Summary and description of case data.
Table 2. Interviews in the client organisation.
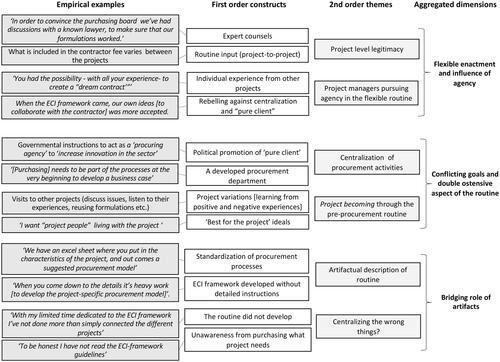
Figure 2. Analytical categorisation and coding structure.
A figure including all the first-order constructs, second-order themes, and aggregated dimensions of the analysis.