1,771
Views
2
CrossRef citations to date
0
Altmetric
Articles

Blueprinting construction logistics services for quality improvement

, ORCID Icon, ORCID Icon, &
Pages 60-78 | Received 16 Jan 2022, Accepted 26 Sep 2022, Published online: 11 Oct 2022

Figures & data

Figure 1. The relationship between a construction project, the construction process and the supply process, based on Friblick (Citation2000) and Thunberg (Citation2016).

A model of a construction project, showing the needed coordination between the supply process and the construction process and how these two processes converge at the on-site production.
Figure 1. The relationship between a construction project, the construction process and the supply process, based on Friblick (Citation2000) and Thunberg (Citation2016).

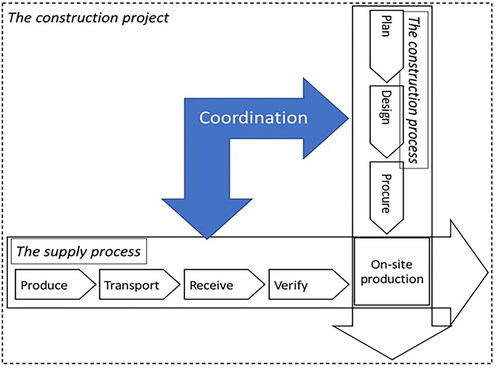
Table 1. Example of studies on modularity in construction.

Figure 2. Research design; data collection stages and their focus. Arrows indicate how the different stages are linked and how their results feed into each other and combined contribute towards the purpose.

Tree stages of data collection based on key respondent interviews, concept mapping, and service blueprinting. These three together supports a focus on quality improvements in construction logistics by identifying enablers of improvements as well as by illustrating service modularity. Altogether the data collection methods and their focus support fulfilling the purpose.
Figure 2. Research design; data collection stages and their focus. Arrows indicate how the different stages are linked and how their results feed into each other and combined contribute towards the purpose.

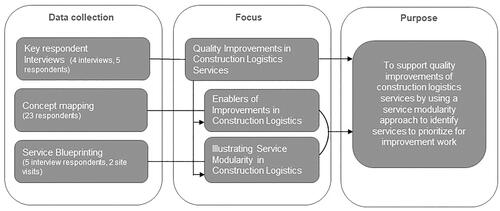
Table 2. Quality criteria applied to enhance validity and reliability.

Figure 3. Nine clusters of aspects critical for improvement work.

Nine clusters of enablers of improvements of construction logistics services in a plot of data points, the placing of the data points show how closely related they are to each other, thereby forming clusters.
Figure 3. Nine clusters of aspects critical for improvement work.

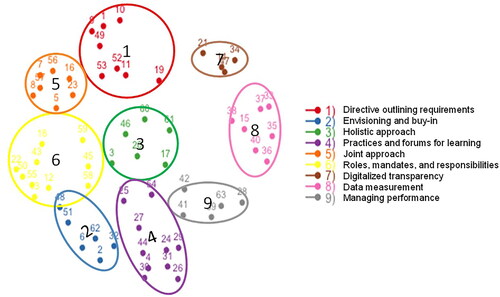
Table 3. Enablers of improvements of construction logistics services – description and examples.

Figure 4. Service blueprint of the studied CLS.

Activities in a construction logistics set-up displayed as boxes, placed on the vertical axis based on them being: physical evidence, customer action, on stage visible action, backstage invisible action, or support processes. Activities are places chronologically on the horizontal axis. The activities are clustered into four service modules: customer adaptation, back-office, on-site interface, and co-ordination interface.
Figure 4. Service blueprint of the studied CLS.

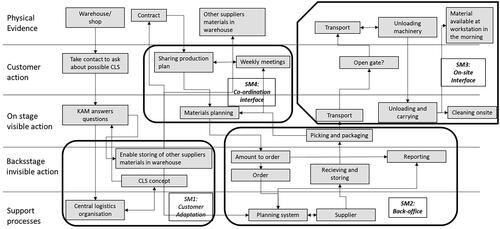
Table 4. Prioritisation matrix for the improvement of construction logistics services based on the CLS blueprinted in .

Data availability statement

The data that support the findings of this study are available from the first author, upon reasonable request.