
Figures & data
Figure 1. Theoretical model of contractor’s inter-regional market entry practice.
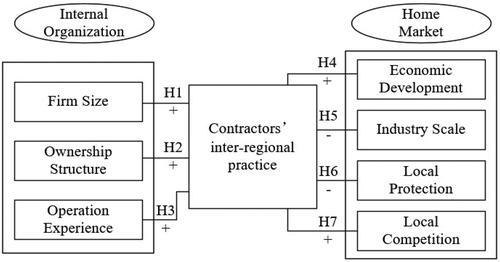
Table 1. Definition and measurement of variables.
Table 2. Demographic information of examined organizations.
Table 3. Logistic regression model results.
Figure 2. Distribution of regional economic development, construction market scale and local protection in China.
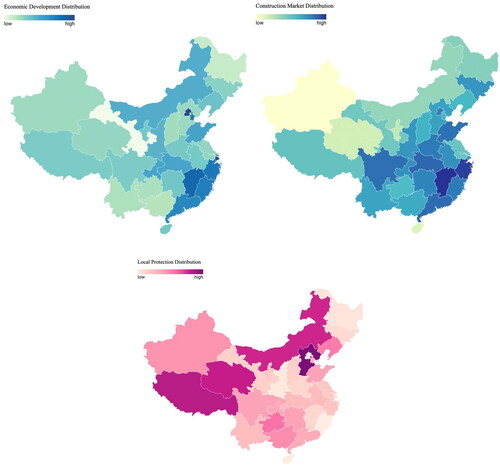
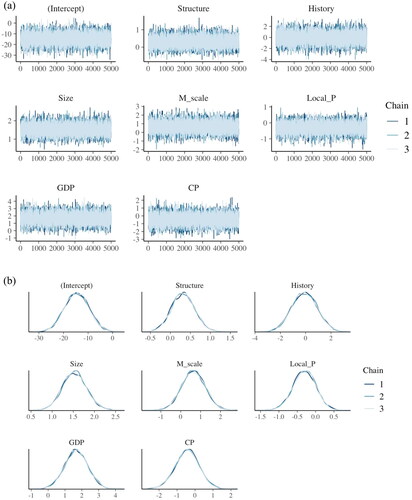
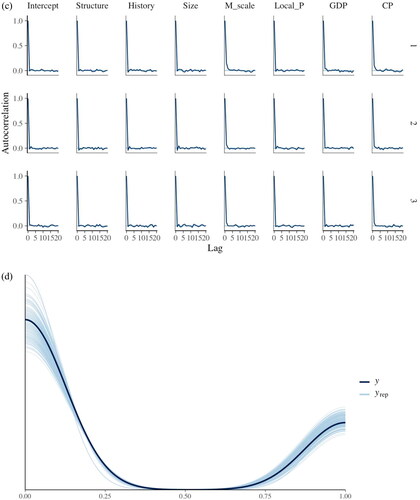
Figure 3. Diagnose result of Bayesian regression model-(a) the trace, (b) dens-overlay, (c) mcmc_acf (d) and pp_check.
Data availability statement
Some or all data, models, or codes that support the findings of this study are available from the corresponding author upon reasonable request.