Figures & data
Figure 1. The total number of tweets collected for each event per day – Hurricane Harvey (left), Hurricane Irma (centre), and Hurricane Maria (right). Horizontal dashed lines show the average number of tweets per day, whereas the solid lines indicate the trends in the daily tweet data volume.
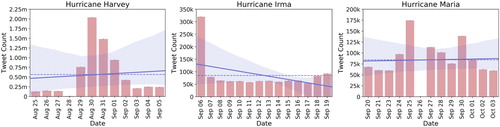
Figure 2. The total number of image tweets collected for each event per day – Hurricane Harvey (left), Hurricane Irma (centre), and Hurricane Maria (right). Horizontal dashed lines show the average number of image tweets per day, whereas the solid lines indicate the trends in the daily image tweets data volume.
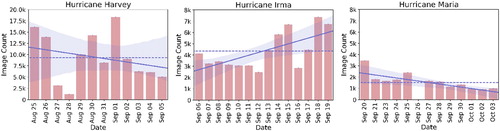
Figure 3. Overview of the proposed methodology with a sequence of data processing components for analysing both text and imagery content.
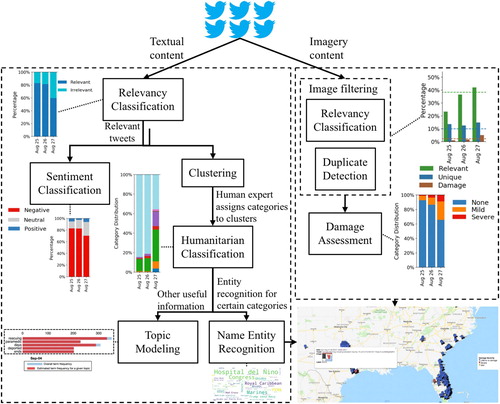
Figure 4. Daily proportion of relevant and irrelevant tweets for Hurricane Harvey (left), Hurricane Irma (center), and Hurricane Maria (right).
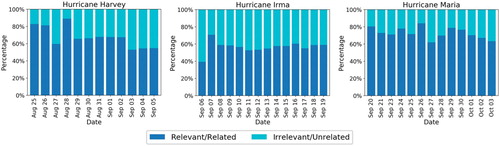
Figure 5. Scatter plots representing the clustering results for Hurricanes Harvey, Irma, and Maria. (a) Hurricane Harvey, 27 August 2017. (b) Hurricane Irma, 7 September 2017 and (c) Hurricane Maria, 20 September 2017.
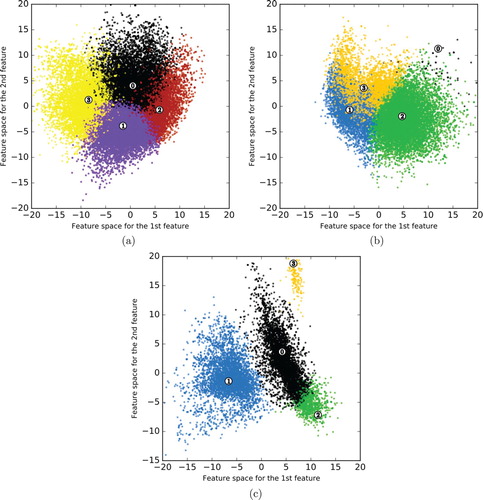
Table 1. Example tweets from the ‘other useful information’ cluster.
Table 2. Data distribution used to train a text classification model for humanitarian categories.
Table 3. Category-wise performance of the text classification model in terms of Precision (P), Recall (R), and F1-score.
Figure 6. Temporal distribution of categories based on the automatic classification of tweet text into one of the humanitarian categories for Hurricane Harvey (left), Hurricane Irma (centre), and Hurricane Maria (right).
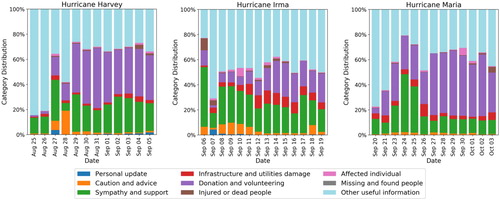
Figure 7. Sentiment analysis results: distribution of daily sentiment for Hurricane Harvey (left), Hurricane Irma (centre), and Hurricane Maria (right).
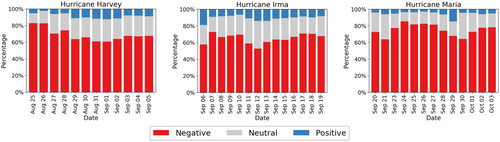
Figure 8. Most frequent entity mentions in the ‘donation and volunteering’ category for Hurricane Harvey. (a) Organisation and (b) person.
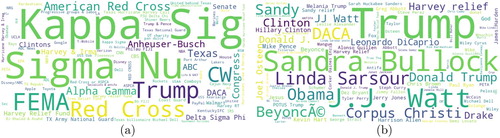
Figure 9. Most frequent entity mentions in the ‘donation and volunteering’ category for Hurricane Irma. (a) Organisation and (b) person.
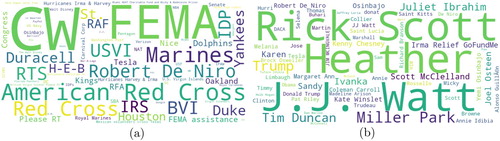
Figure 10. Most frequent entity mentions in the ‘donation and volunteering’ category for Hurricane Maria. (a) Organisation and (b) person.
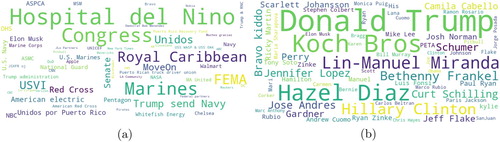
Figure 11. LDA-generated topics from some selected days of Hurricane Harvey. We show the top 30 most relevant words for the most prevalent topic among 10 topics on a given day.
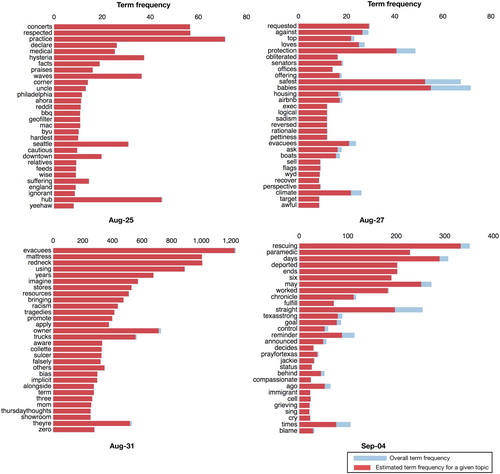
Figure 12. LDA-generated topics from some selected days of Hurricane Irma. We show the top 30 most relevant words for the most prevalent topic among 10 topics on a given day.
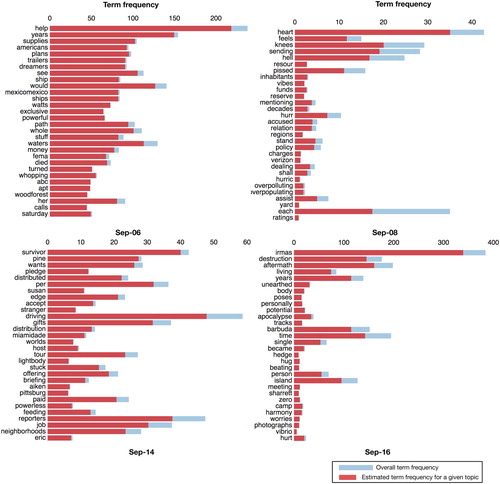
Figure 13. LDA-generated topics from some selected days of Hurricane Maria. We show the top 30 most relevant words for the most prevalent topic among 10 topics on a given day.
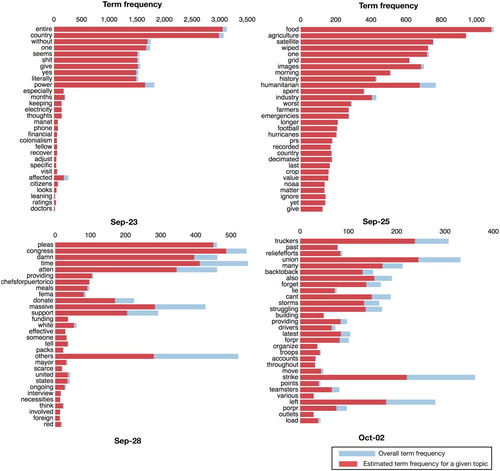
Figure 14. Ratio of daily images retained after relevancy filtering (‘Relevant’), de-duplication (‘Unique’), and damage assessment (‘Damage’) for Hurricane Harvey (left), Hurricane Irma (centre), and Hurricane Maria (right).
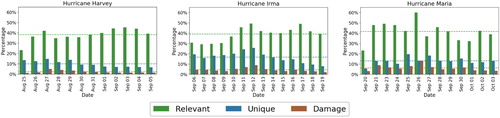
Figure 15. Distribution of ‘severe’, ‘mild’, and ‘none’ damage images after relevancy and uniqueness filtering for Hurricane Harvey (left), Hurricane Irma (centre), and Hurricane Maria (right).
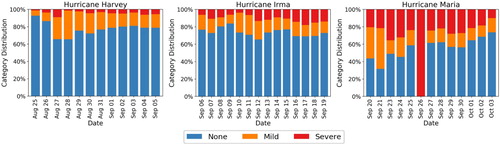
Figure 16. Visualisation of the analytical results on the map. (a) Geotagged tweets with sentiment categories for Hurricane Harvey. (b) Geotagged tweets with humanitarian categories for Hurricane Irma and (c) Geotagged tweets with damage severity categories for Hurricane Maria.
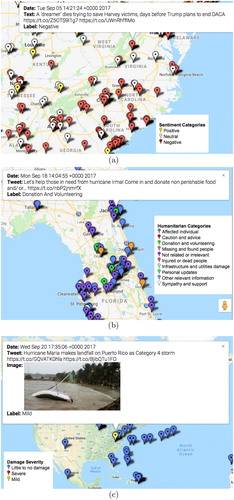
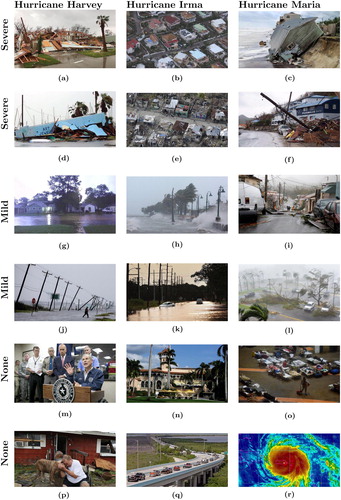
Figure 17. Sample images with different damage levels from different disaster events. Tweet text corresponding to these images are as follows: (a) RT @MikeTheiss: Extreme Damage in Rockport, Texas #HurricaneHarvey. (b) Hurricane Irma's trail of havoc in Sint-Maarten https://t.co/kBiADDJC8E. (c) Hurricane Maria destroys hundreds of homes, knocks out power across Puerto Rico … . (d) Texas county's long recovery from Hurricane Harvey begins. (e) Haiti still has not recovered from Hurricane Matthew. Now here comes Irma. (f) Lehigh Valley residents wait for news as Hurricane Maria sweeps through Caribbean. (g) RT @stephentpaulsen: My street in SE #Houston is now a river. That light is from lightning; it is 10pm #Harvey. (h) AJEnglish: Hurricane Irma causes devastation across the Caribbean. (i) Hurricane Maria blasts Puerto Rico with high winds and flooding. (j) RT euronews ‘At least one person killed as Hurricane Harvey moves inland’. (k) RT @verge: Why do hurricanes have names? (l) RT @fox6now: Timeline of Hurricane Maria's path of destruction over Puerto Rico (m) RT @CBSNews: Texas Gov. Greg Abbott: Search and rescue is the key focus in Harvey response. (n) RT @Reuters: Hurricane Irma threatens luxury Trump properties. (o) Hurricane Maria Makes Landfall In Puerto Rico. (p) RT @nbcsandiego: Dramatic photos of Hurricane Harvey. (q) RT @KLOVEnews: Florida braces for Hurricane Irma, many evacuate the Keys and (r) Hurricane Maria Unleashes Devastating Cat 4 Power On Puerto Rico, Caribbean.