
Figures & data
Table 1. Participants in the study by modality, age, gender, and driving experience.
Figure 1. ATIS interface. To the left, three road users are at a distance (represented by the white lines) behind, to the back right and front right of the car. To the right, there is a pedestrian at a distance in front of the car, and another quite close in the right back blind spot. Some sort of vehicle is very close to the car's right side.
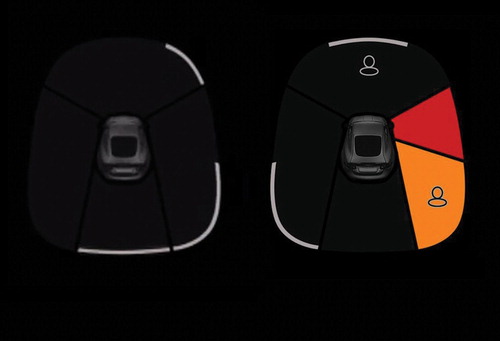
Table 2. Thresholds of warnings in terms of time to collision (seconds) or safety margin (meters).
Figure 2. Driving simulator setup (Wang, Lyckvi, and Chen Citation2016a).
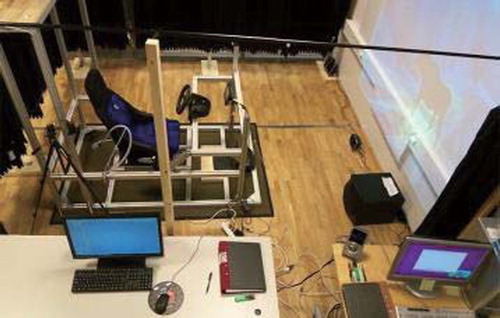
Figure 3. Traffic incidents scenarios.
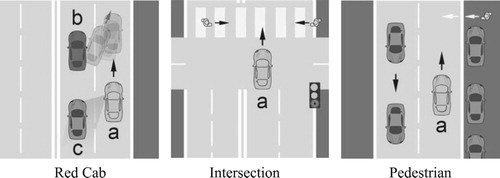
Figure 4. The change of collision number percentage by applying ATIS of two modalities.
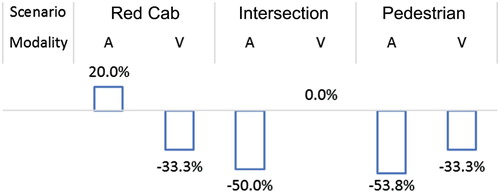
Figure 5. The change of measures value by applying ATIS of different modalities. Error bar indicates one standard deviation (, to illustrate the significance value of measure change affected by ATIS).
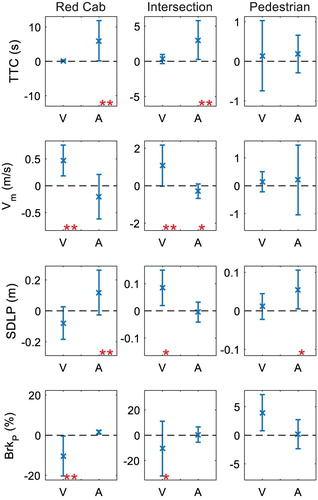
Table 3. Driver reaction patterns of different modalities (results from Single T-test/Wilcoxon rank sum test,  ).
).
Table 4. Modality effect on the driver reaction patterns as a function of scenario (results from Simple effect test), ).
Table 5. A summary of modality effects on the driver reaction patterns across all scenarios (+ indicates positive significance, − indicates negative significance, o indicates no significance).
Data availability
The data that support the findings of this study are available from Volvo Cars. Restrictions apply to the availability of these data, which were used under licence for this study. Data are available from MinJuan Wang with the permission of Volvo Cars.