
Figures & data
Figure 1. Genres preferred by the participants.

Table 1. Demographics of the participants (N = 390).
Table 2. Item factor loadings, means and standard deviations.
Table 3. Correlation table.
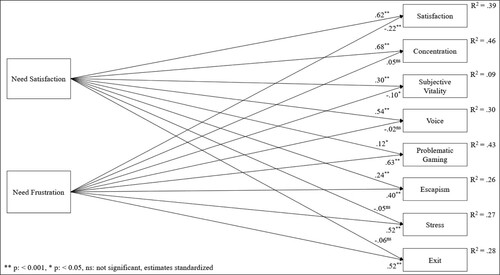
Figure 2. Structural relations between in-game need satisfaction/need frustration and positive/negative outcomes.
Data availability
The data underlying this article is available in FigShare Repository, at https://figshare.com/s/6d95695f61f03383a92c